

Ch. 6 - Confidence Intervals
Larson - Elementary Statistics: Picturing the World 8th Edition
Larson8th EditionElementary Statistics: Picturing the WorldISBN: 9780137493470당신이 사용하는 게 아니라요?교과서 변경
6장, 문제 6.3.5

Finding p^ and q^ In Exercises 3–6, let p be the population proportion for the situation. Find point estimates of p and q.
Social Security In a survey of 661 non-retired Americans, 218 said that they expect to rely on Social Security as major source of income when they retire. (Adapted from Gallup)

검증된 단계별 안내
1
Step 1: Understand the problem. The goal is to find the point estimates of p (the sample proportion of individuals who expect to rely on Social Security as a major source of income) and q (the complement of p, representing those who do not expect to rely on Social Security).
Step 2: Recall the formula for the sample proportion p̂. It is given by: p^=xn, where x is the number of individuals with the characteristic of interest (218 in this case), and n is the total sample size (661 in this case).
Step 3: Substitute the given values into the formula for p̂. This will give you the point estimate for p̂: p^=218661.
Step 4: Recall that q̂ is the complement of p̂, which can be calculated using the formula: q^=1-p^. Use the value of p̂ from Step 3 to compute q̂.
Step 5: Interpret the results. The values of p̂ and q̂ represent the proportions of the sample that expect to rely on Social Security and do not expect to rely on Social Security, respectively.

비슷한 문제에 대한 검증된 영상 답변:

이 영상 해법은 위 문제에 도움이 된다고 튜터들이 추천한 것입니다.
영상 길이:
1m
도움이 되었나요?

주요 개념

질문에 올바르게 답하기 위해 반드시 이해해야 하는 핵심 개념들은 다음과 같습니다.

Population Proportion

The population proportion, denoted as p, is the ratio of members of a population that have a particular characteristic to the total number of members in that population. In this context, it represents the proportion of non-retired Americans who expect to rely on Social Security as a major source of income when they retire.
추천 영상:
05:45
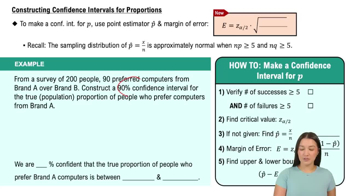
Constructing Confidence Intervals for Proportions

Point Estimate

A point estimate is a single value that serves as an approximation of a population parameter. In this case, p^ (p-hat) is the point estimate of the population proportion p, calculated from sample data. It provides a quick summary of the sample's characteristics, allowing for easier interpretation of the data.
추천 영상:
06:33
Introduction to Confidence Intervals

Complement of the Population Proportion

The complement of the population proportion, denoted as q, represents the proportion of the population that does not have the characteristic of interest. It is calculated as q = 1 - p. In this scenario, q^ (q-hat) would indicate the proportion of non-retired Americans who do not expect to rely on Social Security as a major source of income.
추천 영상:
05:45
Constructing Confidence Intervals for Proportions
관련 실천
교과서 질문

Constructing a Confidence Interval In Exercises 31 and 32, use the data set to (c) construct a 98% confidence interval for the population mean.

[APPLET] Earnings The annual earnings (in dollars) of 32 randomly selected intermediate level life insurance underwriters (Adapted from Salary.com)

85
views
교과서 질문

Bisexual Idenfitication In a survey of 692 lesbian, gay, bisexual, or transgender U.S adults, 378 said that they consider themselves bisexual. Construct a 90% confidence interval for the population proportion of lesbian, gay, bisexual, or transgender U.S. adults who consider themselves bisexual. (Adapted from Gallup)

87
views
교과서 질문

In Exercises 9–12, construct the indicated confidence intervals for (a) the population variance and (b) the population standard deviation . Assume the sample is from a normally distributed population.

c = 0.95, s^2 = 11.56, n = 30

67
views
교과서 질문

Determining a Minimum Sample Size Determine the minimum sample size required when you want to be 99% confident that the sample mean is within two units of the population mean and σ = 1.4. Assume the population is normally distributed.

187
views
교과서 질문

For the same sample statistics, which level of confidence would produce the widest confidence interval? Explain your reasoning.

a. 90%

b. 95%

c. 98%

d. 99%

125
views
교과서 질문

Finding the Margin of Error In Exercises 33 and 34, use the confidence interval to find the estimated margin of error. Then find the sample mean. Book Prices A store manager reports a confidence interval of (244.07, 280.97) when estimating the mean price (in dollars) for the population of textbooks.

59
views