Ch. 6 - Confidence Intervals
Larson - Elementary Statistics: Picturing the World 8th Edition
Larson8th EditionElementary Statistics: Picturing the WorldISBN: 9780137493470당신이 사용하는 게 아니라요?교과서 변경
6장, 문제 6.3.6

Finding p^ and q^ In Exercises 3–6, let p be the population proportion for the situation. Find point estimates of p and q.
Private Internet Browsing In a survey of 4272 U.S. adults, 1025 knew that private browsing mode only prevents someone using the same computer from seeing one’s online activities. (Adapted from Pew Research Center)

검증된 단계별 안내
1
Identify the given values in the problem: The total sample size (n) is 4272, and the number of successes (x) is 1025. A 'success' in this context refers to a respondent knowing that private browsing mode only prevents someone using the same computer from seeing one’s online activities.
Recall the formula for the sample proportion (p̂), which is the point estimate of the population proportion (p). The formula is: p^=xn. Here, x is the number of successes, and n is the total sample size.
Substitute the given values into the formula for p̂: p^=10254272. This will give the point estimate of the population proportion.
To find q̂, which is the complement of p̂, use the formula: q^=1-p^. This represents the proportion of respondents who do not know that private browsing mode only prevents someone using the same computer from seeing one’s online activities.
Substitute the calculated value of p̂ into the formula for q̂ to find the complement proportion. This completes the calculation of both p̂ and q̂.

비슷한 문제에 대한 검증된 영상 답변:

이 영상 해법은 위 문제에 도움이 된다고 튜터들이 추천한 것입니다.
영상 길이:
1m
도움이 되었나요?

주요 개념

질문에 올바르게 답하기 위해 반드시 이해해야 하는 핵심 개념들은 다음과 같습니다.

Population Proportion

The population proportion, denoted as p, represents the fraction of a population that possesses a certain characteristic. In this context, it refers to the proportion of U.S. adults who understand the function of private browsing mode. It is calculated by dividing the number of individuals with the characteristic by the total number of individuals surveyed.
추천 영상:
가이드 코스
05:45
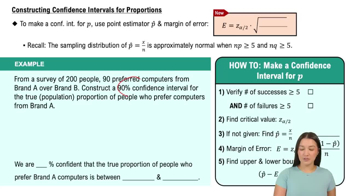
Constructing Confidence Intervals for Proportions

Point Estimate

A point estimate is a single value that serves as an approximation of a population parameter. In this case, p^ (p-hat) is the point estimate of the population proportion p, calculated from sample data. It provides a quick estimate of the true population proportion based on the observed sample.
추천 영상:
가이드 코스
06:33
Introduction to Confidence Intervals

Complement of a Proportion

The complement of a proportion, denoted as q, represents the proportion of the population that does not have the characteristic of interest. It is calculated as q = 1 - p. In this scenario, q would indicate the proportion of U.S. adults who do not understand the private browsing mode, providing a complete view of the population's knowledge.
추천 영상:
가이드 코스
08:09
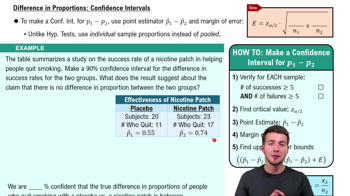
Difference in Proportions: Confidence Intervals
관련 실천
교과서 질문

Finding Critical Values for χ2 In Exercises 3–8, find the critical values χR2 and χL2 for the level of confidence c and sample size n.

c = 0.95, n = 20

42
views

교과서 질문

Constructing Confidence Intervals In Exercises 11 and 12, construct 90% and 95% confidence intervals for the population proportion. Interpret the results and compare the widths of the confidence intervals.

New Year’s Resolutions In a survey of 1790 U.S. adults in a recent year, 816 have a New Year’s resolution related to their health. (Adapted from Finder)

151
views
교과서 질문

You research prices of cell phones and find that the population mean is \$431.61. In Exercise 19, does the t-value fall between -t0.95 and t0.95?

71
views
교과서 질문

In Exercises 35–40, use the standard normal distribution or the t-distribution to construct a 95% confidence interval for the population mean. Justify your decision. If neither distribution can be used, explain why. Interpret the results.

The population standard deviation of the weights of the two-year-old males on a pediatrician’s patient list is 2.49 pounds. The mean weight of a sample of 10 of the two–year–old males is 13.68 pounds. Weights are known to be normally distributed.

85
views
교과서 질문

In Exercises 25–28, use the confidence interval to find the margin of error and the sample mean.

(3.144, 3.176)

91
views
교과서 질문

In Exercise 37, does it seem likely that the population mean could be greater than \$70? Explain.

75
views