Ch. 6 - Confidence Intervals
Larson - Elementary Statistics: Picturing the World 8th Edition
Larson8th EditionElementary Statistics: Picturing the WorldISBN: 9780137493470당신이 사용하는 게 아니라요?교과서 변경
6장, 문제 6.3.3

"Finding p^ and q^ In Exercises 3–6, let p be the population proportion for the situation. Find point estimates of p and q.
Tax Fraud In a survey of 1040 U.S. adults, 62 have had someone impersonate them to try to claim tax refunds. (Adapted from Pew Research Center)"

검증된 단계별 안내
1
Identify the given information: The total number of U.S. adults surveyed is 1040, and the number of adults who have had someone impersonate them to claim tax refunds is 62.
Understand the concept: The point estimate for the population proportion (p̂) is calculated as the ratio of the number of successes (in this case, adults impersonated) to the total sample size. The formula is p̂ = x / n, where x is the number of successes and n is the total sample size.
Substitute the given values into the formula for p̂: Use x = 62 and n = 1040 to calculate p̂.
Find q̂, the complement of p̂: Recall that q̂ = 1 - p̂. Once p̂ is calculated, subtract it from 1 to find q̂.
Interpret the results: p̂ represents the proportion of adults in the sample who have been impersonated for tax fraud, and q̂ represents the proportion of adults in the sample who have not been impersonated for tax fraud.

비슷한 문제에 대한 검증된 영상 답변:

이 영상 해법은 위 문제에 도움이 된다고 튜터들이 추천한 것입니다.
영상 길이:
2m
도움이 되었나요?

주요 개념

질문에 올바르게 답하기 위해 반드시 이해해야 하는 핵심 개념들은 다음과 같습니다.

Population Proportion

The population proportion, denoted as p, represents the fraction of a population that possesses a certain characteristic. In this context, it refers to the proportion of U.S. adults who have experienced impersonation for tax fraud. Understanding this concept is crucial for estimating how widespread the issue is within the entire population based on survey data.
추천 영상:
가이드 코스
02:35
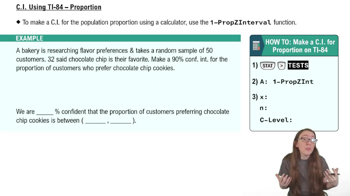
Finding a Confidence Interval for a Population Proportion Using a TI84

Point Estimate

A point estimate is a single value derived from sample data that serves as a best guess for a population parameter. In this case, p^ (p-hat) is the point estimate of the population proportion p, calculated by dividing the number of individuals with the characteristic (62) by the total sample size (1040). This estimate provides a quick snapshot of the population's behavior regarding tax fraud.
추천 영상:
가이드 코스
06:33
Introduction to Confidence Intervals

Complement of the Population Proportion

The complement of the population proportion, denoted as q, represents the proportion of the population that does not have the characteristic in question. It is calculated as q = 1 - p. In the context of the survey, q would indicate the proportion of U.S. adults who have not experienced impersonation for tax fraud, providing a complete view of the situation.
추천 영상:
가이드 코스
02:35
Finding a Confidence Interval for a Population Proportion Using a TI84
관련 실천
교과서 질문

In Exercises 9–12, construct the indicated confidence intervals for (a) the population variance and (b) the population standard deviation . Assume the sample is from a normally distributed population.

c = 0.90, s^2 = 35, n = 18

61
views

교과서 질문

In Exercises 9–12, construct the indicated confidence intervals for (a) the population variance and (b) the population standard deviation . Assume the sample is from a normally distributed population.

c = 0.98, s^2 = 278.1, n =41

92
views
교과서 질문

In Exercises 21–24, construct the indicated confidence interval for the population mean μ.

c = 0.80, xbar = 20.6, σ = 4.7, n = 100.

97
views
교과서 질문

Translating Statements In Exercises 29–34, translate the statement into a confidence interval. Approximate the level of confidence.

In a survey of 880 unmarried U.S. adults who are living with a partner, 73% say love was a major reason why they decided to move in together. The survey’s margin of error is ±4.8%. (Source: Pew Research Center)

66
views
교과서 질문

Does a population have to be normally distributed to use the chi-square distribution?

261
views
교과서 질문

Constructing a Confidence Interval In Exercises 17–20, you are given the sample mean and the sample standard deviation. Assume the population is normally distributed and use the t-distribution to find the margin of error and construct a 95% confidence interval for the population mean. Interpret the results.

Commute Time In a random sample of eight people, the mean commute time to work was 35.5 minutes and the standard deviation was 7.2 minute

148
views