Ch. 6 - Confidence Intervals
Larson - Elementary Statistics: Picturing the World 8th Edition
Larson8th EditionElementary Statistics: Picturing the WorldISBN: 9780137493470당신이 사용하는 게 아니라요?교과서 변경
6장, 문제 6.3.21

In Exercise 11, would it be unusual for the population proportion to be 72.5%? Explain.

검증된 단계별 안내
1
Step 1: Identify the context of the problem. The question is asking whether a population proportion of 72.5% is unusual. To determine this, we need to assess the concept of 'unusual' in statistics, which typically refers to values that are far from the mean (e.g., more than 2 standard deviations away).
Step 2: Recall the formula for the standard error of the proportion (SE). The formula is: SE = sqrt((p(1 - p)) / n), where p is the population proportion and n is the sample size.
Step 3: Determine the z-score for the given proportion. The z-score formula is: z = (p - p0) / SE, where p0 is the hypothesized population proportion, p is the observed proportion, and SE is the standard error.
Step 4: Compare the z-score to the critical values for a standard normal distribution. Typically, a z-score beyond ±2 is considered unusual because it corresponds to the tails of the distribution (less than 5% of the data).
Step 5: Conclude whether the population proportion of 72.5% is unusual based on the z-score and the critical values. If the z-score is within ±2, it is not unusual; otherwise, it is unusual.

비슷한 문제에 대한 검증된 영상 답변:

이 영상 해법은 위 문제에 도움이 된다고 튜터들이 추천한 것입니다.
영상 길이:
2m
도움이 되었나요?

주요 개념

질문에 올바르게 답하기 위해 반드시 이해해야 하는 핵심 개념들은 다음과 같습니다.

Population Proportion

Population proportion refers to the fraction of a population that possesses a certain characteristic. It is a key parameter in statistics, often denoted as 'p', and is used to summarize categorical data. Understanding the population proportion helps in making inferences about the entire population based on sample data.
추천 영상:
05:45
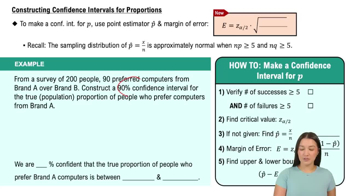
Constructing Confidence Intervals for Proportions

Statistical Significance

Statistical significance assesses whether the observed data deviates from what would be expected under a null hypothesis. A population proportion of 72.5% may be considered unusual if it falls outside the range of expected values based on sample data and confidence intervals. This concept is crucial for determining if a result is likely due to chance or represents a true effect.
추천 영상:
가이드 코스
05:53
Parameters vs. Statistics

Confidence Intervals

A confidence interval provides a range of values within which the true population parameter is expected to lie, with a certain level of confidence (e.g., 95%). If 72.5% falls outside this interval, it may indicate that this proportion is unusual or not representative of the population. Confidence intervals are essential for understanding the precision of estimates and making informed decisions based on sample data.
추천 영상:
06:33
Introduction to Confidence Intervals