

Ch. 7 - Hypothesis Testing with One Sample
Larson - Elementary Statistics: Picturing the World 8th Edition
Larson8th EditionElementary Statistics: Picturing the WorldISBN: 9780137493470당신이 사용하는 게 아니라요?교과서 변경
7장, 문제 7.Q.4

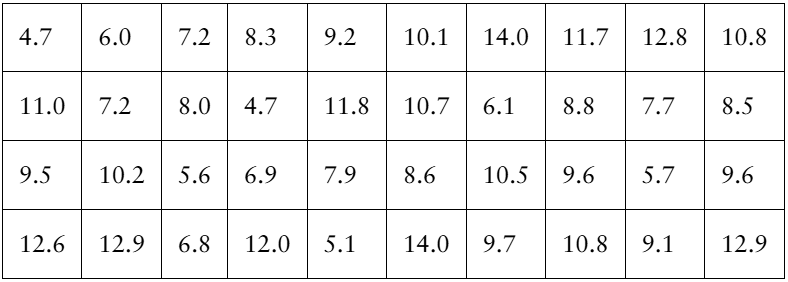
[APPLET] A weight loss program claims that program participants have a mean weight loss of at least 10.5 pounds after 1 month. The weight losses after 1 month (in pounds) of a random sample of 40 program participants are listed below. At α=0.01, is there enough evidence to reject the program’s claim?


<IMAGE>

검증된 단계별 안내
1
Step 1: Formulate the null and alternative hypotheses. The null hypothesis (H₀) is that the mean weight loss is at least 10.5 pounds (H₀: μ ≥ 10.5). The alternative hypothesis (H₁) is that the mean weight loss is less than 10.5 pounds (H₁: μ < 10.5).
Step 2: Calculate the sample mean (x̄) and sample standard deviation (s) using the provided data. Use the formulas for the sample mean (x̄ = Σx / n) and the sample standard deviation (s = √[Σ(x - x̄)² / (n - 1)]), where n is the sample size.
Step 3: Determine the test statistic. Since the population standard deviation is not provided, use the t-test formula: t = (x̄ - μ) / (s / √n), where μ is the hypothesized population mean (10.5 pounds), x̄ is the sample mean, s is the sample standard deviation, and n is the sample size.
Step 4: Find the critical value for the t-test at a significance level of α = 0.01 with degrees of freedom (df = n - 1). Use a t-distribution table or statistical software to find the critical t-value for a one-tailed test.
Step 5: Compare the calculated t-test statistic to the critical t-value. If the test statistic is less than the critical value, reject the null hypothesis. Otherwise, fail to reject the null hypothesis. Interpret the result in the context of the problem.

비슷한 문제에 대한 검증된 영상 답변:

이 영상 해법은 위 문제에 도움이 된다고 튜터들이 추천한 것입니다.
영상 길이:
5m
도움이 되었나요?

주요 개념

질문에 올바르게 답하기 위해 반드시 이해해야 하는 핵심 개념들은 다음과 같습니다.

Hypothesis Testing

Hypothesis testing is a statistical method used to make decisions about a population based on sample data. It involves formulating a null hypothesis (H0) and an alternative hypothesis (H1). In this case, the null hypothesis would state that the mean weight loss is less than or equal to 10.5 pounds, while the alternative hypothesis would assert that it is greater than 10.5 pounds. The goal is to determine if there is enough evidence to reject the null hypothesis at a specified significance level (α).
추천 영상:
가이드 코스
06:21
Step 1: Write Hypotheses

Significance Level (α)

The significance level, denoted as α, is the threshold for determining whether to reject the null hypothesis. It represents the probability of making a Type I error, which occurs when the null hypothesis is incorrectly rejected. In this scenario, α is set at 0.01, indicating a 1% risk of concluding that the program's claim is false when it is actually true. A lower α value means a stricter criterion for evidence against the null hypothesis.
추천 영상:
03:33
Finding Binomial Probabilities Using TI-84 Example 1

Sample Mean and Standard Deviation

The sample mean is the average weight loss of the participants in the study, calculated by summing all the individual weight losses and dividing by the number of participants. The standard deviation measures the variability of the weight losses around the mean. These statistics are crucial for conducting hypothesis tests, as they help determine the test statistic, which is used to compare against critical values to decide whether to reject the null hypothesis.
추천 영상:
가이드 코스
08:45
Calculating Standard Deviation
관련 실천
교과서 질문

A hat company claims that the mean hat size for a male is at least 7.25. A random sample of 12 hat sizes has a mean of 7.15. At α=0.01, can you reject the company’s claim? Assume the population is normally distributed and the population standard deviation is 0.27.

56
views
교과서 질문

In Exercises 3–8, find the critical value(s) and rejection region(s) for the type of t-test with level of significance alpha and sample size n.


Left-tailed test, α=0.10, n=20

75
views
교과서 질문

In Exercises 3–6, determine whether a normal sampling distribution can be used. If it can be used, test the claim.

Claim: p ≥0.48, α=0.08. Sample statistics: p_hat = 0.40, n=90

50
views
교과서 질문

What are the two types of hypotheses used in a hypothesis test? How are they related?

221
views
교과서 질문

A travel analyst claims the mean daily base price for renting a full-size or less expensive vehicle in Vancouver, British Columbia, is more than \(86. You want to test this claim. In a random sample of 40 full-size or less expensive vehicles available to rent in Vancouver, British Columbia, the mean daily base price is \)93.23. Assume the population standard deviation is \$28.90. At α=0.10, do you have enough evidence to support the analyst’s claim?

37
views
교과서 질문

A government agency reports that the mean amount of earnings for full-time workers ages 18 to 24 with a bachelor’s degree in a recent year is \(52,133. In a random sample of 15 full-time workers ages 18 to 24 with a bachelor’s degree, the mean amount of earnings is \)48,400 and the standard deviation is \$6679. At α=0.05, is there enough evidence to reject the claim? Assume the population is normally distributed.

52
views