


Ch. 8 - Hypothesis Testing with Two Samples
Larson - Elementary Statistics: Picturing the World 8th Edition
Larson8th EditionElementary Statistics: Picturing the WorldISBN: 9780137493470당신이 사용하는 게 아니라요?교과서 변경
8장, 문제 8.2.26

Constructing Confidence Intervals for μ1-μ2. When the sampling distribution for x̅1-x̅2 is approximated by a t-distribution and the populations have equal variances, you can construct a confidence interval for μ1-μ2, as shown below.
Construct the indicated confidence interval for μ1-μ2 . Assume the populations are approximately normal with equal variances.
10K Race 
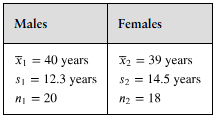
To compare the mean ages of male and female participants in a 10K race, you randomly select several ages from both sexes. The results are shown below. Construct a 95% confidence interval for the difference in mean ages of male and female participants in the race. (Adapted from Great Race)
Table comparing sample means, standard deviations, and sizes for ages of male and female 10K race participants.

검증된 단계별 안내
1
Identify the sample statistics for both groups: males and females. For males, the sample mean is \(\bar{x}_1 = 40\), the sample standard deviation is \(s_1 = 12.3\), and the sample size is \(n_1 = 20\). For females, the sample mean is \(\bar{x}_2 = 39\), the sample standard deviation is \(s_2 = 14.5\), and the sample size is \(n_2 = 18\).
Since the populations are assumed to have equal variances, calculate the pooled standard deviation \(s_p\) using the formula: \[s_p = \sqrt{\frac{(n_1 - 1)s_1^2 + (n_2 - 1)s_2^2}{n_1 + n_2 - 2}}\]
Calculate the standard error (SE) of the difference between the two sample means using the pooled standard deviation: \[SE = s_p \times \sqrt{\frac{1}{n_1} + \frac{1}{n_2}}\]
Determine the degrees of freedom (df) for the t-distribution, which is \(df = n_1 + n_2 - 2\).
Find the critical t-value (\(t^*\)) for a 95% confidence interval with the calculated degrees of freedom. Then, construct the confidence interval for the difference in means (\(\mu_1 - \mu_2\)) using the formula: \[\left( (\bar{x}_1 - \bar{x}_2) - t^* \times SE, \quad (\bar{x}_1 - \bar{x}_2) + t^* \times SE \right)\]

비슷한 문제에 대한 검증된 영상 답변:

이 영상 해법은 위 문제에 도움이 된다고 튜터들이 추천한 것입니다.
영상 길이:
6m
도움이 되었나요?

주요 개념

질문에 올바르게 답하기 위해 반드시 이해해야 하는 핵심 개념들은 다음과 같습니다.

Confidence Interval for Difference of Means

A confidence interval for the difference between two population means (μ1 - μ2) estimates the range within which the true difference lies with a certain level of confidence, typically 95%. It is calculated using sample means, standard deviations, and sample sizes, providing insight into whether the means differ significantly.
추천 영상:
가이드 코스
08:21
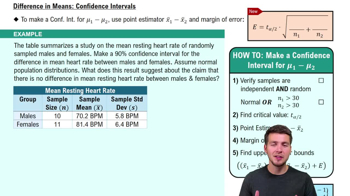
Difference in Means: Confidence Intervals

Pooled Variance and Equal Variance Assumption

When populations have equal variances, the pooled variance combines the sample variances weighted by their degrees of freedom. This pooled estimate improves the accuracy of the standard error used in the t-distribution, which is essential for constructing the confidence interval for the difference in means.
추천 영상:
가이드 코스
04:48
Variance & Standard Deviation of Discrete Random Variables

t-Distribution and Degrees of Freedom

The t-distribution is used instead of the normal distribution when sample sizes are small and population variance is unknown. Degrees of freedom, calculated based on sample sizes, determine the shape of the t-distribution and the critical t-value needed to construct the confidence interval.
추천 영상:
05:50
Critical Values: t-Distribution
관련 실천
교과서 질문

Independent and Dependent Samples In Exercises 5–8, classify the two samples as independent or dependent and justify your answer.

Sample 1: The commute times of 10 workers when they use their own vehicles

Sample 2: The commute times of the same 10 workers when they use public transportation

61
views
교과서 질문

Getting at the Concept Explain why the null hypothesis Ho: μ1=μ2 is equivalent to the null hypothesis .Ho: μ1-μ2=0

168
views
교과서 질문

Seat Belt Use In a survey of 1000 drivers from the West, 934 wear a seat belt. In a survey of 1000 drivers from the Northeast, 909 wear a seat belt. At α=0.05, can you support the claim that the proportion of drivers who wear seat belts is greater in the West than in the Northeast? (Adapted from National Highway Traffic Safety Administration)

46
views
교과서 질문

In Exercises 11–14, test the claim about the difference between two population means and at the level of significance . Assume the samples are random and independent, and the populations are normally distributed.

Claim: μ1<μ2; α=0.05

Population statistics:σ1=75 and σ2=105

Sample Statistics: x̅1=2435, n1=35, x̅2=2432, n2=90

80
views
교과서 질문

Parks and Mental Health In Exercises 13–18, use the figure, which shows the percentages from a survey of two hundred 18- to 24-year-olds in the United States who say that various park and recreation activities have a positive impact on their mental health. (Adapted from National Recreation and Park Association)


Socializing and Taking Classes At α=0.05, can you support the claim that the proportion of 18- to 24-year-olds who benefit mentally from socializing in parks is different from the proportion who benefit mentally from taking classes in parks?

48
views
교과서 질문

In Exercises 11–14, test the claim about the difference between two population means and at the level of significance . Assume the samples are random and independent, and the populations are normally distributed.

Claim: μ1=μ2; α=0.1

Population statistics:σ1=3.4 and σ2=1.5

Sample Statistics: x̅1=16, n1=29, x̅2=14, n2=28

51
views