Ch. 8 - Hypothesis Testing with Two Samples
Larson - Elementary Statistics: Picturing the World 8th Edition
Larson8th EditionElementary Statistics: Picturing the WorldISBN: 9780137493470당신이 사용하는 게 아니라요?교과서 변경
8장, 문제 8.1.30

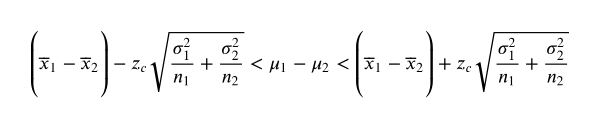
Constructing Confidence Intervals for μ1-μ2. You can construct a confidence interval for the difference between two population means μ1-μ2 , as shown below, when both population standard deviations are known, and either both populations are normally distributed or both n1>= 30 and n2>=30 . Also, the samples must be randomly selected and independent.
Equation showing the confidence interval formula for the difference between two population means with known variances.
In Exercises 29 and 30, construct the indicated confidence interval for μ1-μ2 .


Architect Salaries Construct a 99% confidence interval for the difference between the mean annual salaries of entry level architects in Denver, Colorado, and Lincoln, Nebraska, using the data from Exercise 28.

검증된 단계별 안내
1
Step 1: Identify the sample means (\(\bar{x}_1\), \(\bar{x}_2\)), population standard deviations (\(\sigma_1\), \(\sigma_2\)), and sample sizes (\(n_1\), \(n_2\)) for the two groups (entry level architects in Denver and Lincoln).
Step 2: Determine the critical value \(z_c\) corresponding to the desired confidence level (99%) from the standard normal distribution table.
Step 3: Calculate the standard error of the difference between the two means using the formula: \(\sqrt{\frac{\sigma_1^2}{n_1} + \frac{\sigma_2^2}{n_2}}\).
Step 4: Construct the confidence interval for \(\mu_1 - \mu_2\) using the formula: \(\left( \bar{x}_1 - \bar{x}_2 \right) \pm z_c \times \sqrt{\frac{\sigma_1^2}{n_1} + \frac{\sigma_2^2}{n_2}}\).
Step 5: Interpret the interval to understand the range in which the true difference between the population means lies with 99% confidence.

비슷한 문제에 대한 검증된 영상 답변:

이 영상 해법은 위 문제에 도움이 된다고 튜터들이 추천한 것입니다.
영상 길이:
4m
도움이 되었나요?

주요 개념

질문에 올바르게 답하기 위해 반드시 이해해야 하는 핵심 개념들은 다음과 같습니다.

Confidence Interval for the Difference Between Two Means

A confidence interval estimates the range within which the true difference between two population means (μ1 - μ2) lies, with a specified level of confidence (e.g., 99%). It is calculated using sample means, known population variances, and a critical value from the standard normal distribution.
추천 영상:
가이드 코스
08:21
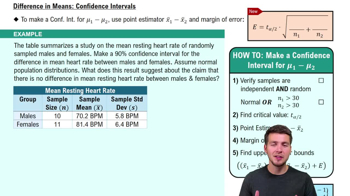
Difference in Means: Confidence Intervals

Conditions for Using the Confidence Interval Formula

This method requires that both population standard deviations are known, and either both populations are normally distributed or the sample sizes are large (n1 ≥ 30 and n2 ≥ 30). Additionally, samples must be randomly selected and independent to ensure valid inference.
추천 영상:
04:30
Finding Confidence Intervals Using TI-84

Critical Value and Standard Error in the Formula

The critical value (z_c) corresponds to the desired confidence level and is derived from the standard normal distribution. The standard error combines the variances of both samples, adjusted by their sample sizes, reflecting the variability in the difference between sample means.
추천 영상:
04:46
Critical Values: z Scores
관련 실천
교과서 질문

In Exercises 11–14, test the claim about the difference between two population means and at the level of significance . Assume the samples are random and independent, and the populations are normally distributed.

Claim: μ1>μ2; α=0.10

Population statistics:σ1=40 and σ2=15

Sample Statistics: x̅1=500, n1=100, x̅2=495, n2=75

55
views
교과서 질문

Test the claim about the difference between two population means and at the level of significance α. Assume the samples are random and independent, and the populations are normally distributed.

Claim: μ1>μ2, α=0.01, Assume (σ1)^2≠(σ2)^2 

Sample statistics:

x̅1=52, s1=4.8, n1=32 and x̅2=50, s2=1.2, n2=40

68
views
교과서 질문

Testing a Difference Other Than Zero Sometimes a researcher is interested in testing a difference in means other than zero. In Exercises 27 and 28, you will test the difference between two means using a null hypothesis of Ho: μ1-μ2=k, Ho: μ1-μ2>=k or Ho: μ1-μ2<=k . The standardized test statistic is still

Software Engineer Salaries Is the difference between the mean annual salaries of entry level software engineers in Santa Clara, California, and Greenwich, Connecticut, more than \(4000? To decide, you select a random sample of entry level software engineers from each city. The results of each survey are shown in the figure at the left. Assume the population standard deviations are σ1=\)14,060 and σ2=\$13,050 . At α=0.05, what should you conclude? (Adapted from Salary.com)

77
views
교과서 질문

Test the claim about the difference between two population means and at the level of significance α. Assume the samples are random and independent, and the populations are normally distributed.

Claim: μ1≤μ2, α=0.05, Assume (σ1)^2≠(σ2)^2

Sample statistics:

x̅1=2410, s1=175, n1=13 and x̅2=2305, s2=52, n2=10

112
views
교과서 질문

Testing the Difference Between Two Means, (a) identify the claim and state H0 and Ha , (b) find the critical value(s) and identify the rejection region(s), (c) find the standardized test statistic t, (d) decide whether to reject or fail to reject the null hypothesis, and (e) interpret the decision in the context of the original claim. Assume the samples are random and independent, and the populations are normally distributed.

Pet Food

A pet association claims that the mean annual costs of food for dogs and cats are the same. The results for samples of the two types of pets are shown at the left. At , α=0.10 can you reject the pet association’s claim? Assume the population variances are equal. (Adapted from American Pet Products Association)

70
views
교과서 질문

Testing a Difference Other Than Zero Sometimes a researcher is interested in testing a difference in means other than zero. In Exercises 27 and 28, you will test the difference between two means using a null hypothesis of Ho: μ1-μ2=k, Ho: μ1-μ2>=k or Ho: μ1-μ2<=k . The standardized test statistic is still

Architect Salaries Is the difference between the mean annual salaries of entry level architects in Denver, Colorado, and Lincoln, Nebraska, equal to \(9000? To decide, you select a random sample of entry level architects from each city. The results of each survey are shown in the figure. Assume the population standard deviations are σ1=\)6560 and σ2=\$6100 . At α=0.01 what should you conclude? (Adapted from Salary.com)

36
views