

Ch. 8 - Hypothesis Testing with Two Samples
Larson - Elementary Statistics: Picturing the World 8th Edition
Larson8th EditionElementary Statistics: Picturing the WorldISBN: 9780137493470당신이 사용하는 게 아니라요?교과서 변경
8장, 문제 8.3.14

Testing the Difference Between Two Means (a) identify the claim and state Ho and Ha , (b) find the critical value(s) and identify the rejection region(s), (c) calculate d̄ and Sd, (d) find the standardized test statistic t, (e) decide whether to reject or fail to reject the null hypothesis, and (f) interpret the decision in the context of the original claim. Assume the samples are random and dependent, and the populations are normally distributed.
[APPLET] Therapeutic Taping
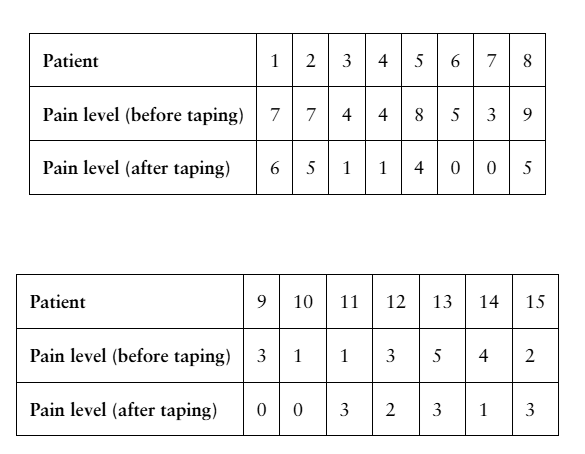
A physical therapist claims that the use of a specific type of therapeutic tape reduces pain in patients with chronic tennis elbow. The table shows the pain levels on a scale of 0 to 10, where 0 is no pain and 10 is the worst pain possible, for 15 patients with chronic tennis elbow when holding a 1 kilogram weight. At , α=0.05 is there enough evidence to support the therapist’s claim? (Adapted from BioMed Central, Ltd.)
Table showing pain levels for 15 patients before and after therapeutic taping, with most pain scores decreasing post-taping.

검증된 단계별 안내
1
Step (a): Identify the claim and state the null hypothesis (H\_0) and alternative hypothesis (H\_a). Since the therapist claims that the tape reduces pain, the claim is that the mean pain level after taping is less than before taping. Therefore, H\_0: \(\mu\)_d = 0 (no difference in mean pain levels) and H\_a: \(\mu\)_d > 0 (mean pain level before taping is greater than after taping, indicating a reduction).
Step (b): Find the critical value(s) and identify the rejection region(s). Since the samples are dependent and the claim is one-sided (reduction in pain), use a t-distribution with degrees of freedom df = n - 1, where n is the number of patients (15). Find the critical t-value for \(\alpha\) = 0.05 and df = 14. The rejection region is t > critical value.
Step (c): Calculate the differences d for each patient by subtracting the pain level after taping from the pain level before taping (d = before - after). Then calculate the sample mean of the differences (\(\overline{d}\)) and the sample standard deviation of the differences (S_d).
Step (d): Calculate the standardized test statistic t using the formula: \(t = \frac{\overline{d} - 0}{S_d / \sqrt{n}}\) where \(\overline{d}\) is the mean difference, S_d is the standard deviation of the differences, and n is the sample size.
Step (e): Compare the calculated t statistic to the critical t-value. If t is greater than the critical value, reject the null hypothesis; otherwise, fail to reject it.
Step (f): Interpret the decision in the context of the original claim. If the null hypothesis is rejected, conclude that there is sufficient evidence at the 0.05 significance level to support the therapist's claim that the therapeutic tape reduces pain. If not rejected, conclude that there is not enough evidence to support the claim.

비슷한 문제에 대한 검증된 영상 답변:

이 영상 해법은 위 문제에 도움이 된다고 튜터들이 추천한 것입니다.
영상 길이:
5m
도움이 되었나요?

주요 개념

질문에 올바르게 답하기 위해 반드시 이해해야 하는 핵심 개념들은 다음과 같습니다.

Dependent Samples t-Test

A dependent samples t-test compares the means of two related groups to determine if there is a statistically significant difference between them. It is used when the same subjects are measured before and after a treatment, as in this pain level study. The test accounts for the paired nature of the data, focusing on the differences within each pair.
추천 영상:
05:17
Multiplication Rule: Dependent Events

Hypothesis Testing (Null and Alternative Hypotheses)

Hypothesis testing involves stating a null hypothesis (H0) that assumes no effect or difference, and an alternative hypothesis (Ha) that reflects the claim being tested. In this context, H0 might state that therapeutic taping does not reduce pain, while Ha claims it does. The test evaluates evidence to reject or fail to reject H0 based on sample data.
추천 영상:
05:52
Performing Hypothesis Tests: Proportions

Critical Value and Rejection Region

The critical value is a threshold that determines the boundary of the rejection region in hypothesis testing. At a given significance level (α=0.05), if the test statistic falls into this region, the null hypothesis is rejected. For a t-test, critical values depend on degrees of freedom and whether the test is one- or two-tailed.
추천 영상:
05:50
Critical Values: t-Distribution
관련 실천
교과서 질문

Annual Income

A politician claims that the mean household income in a recent year is greater in York County, South Carolina, than it is in Elmore County, Alabama. In York County, a sample of 23 residents has a mean household income of \$64,900 and a standard deviation of \$16,000. In Elmore County, a sample of 19 residents has a mean household income of \$59,500 and a standard deviation of \$23,600. At , α= 0.05can you support the politician’s claim? Assume the population variances are not equal. (Adapted from U.S. Census Bureau)

42
views
교과서 질문

Constructing Confidence Intervals for p1-p2 You can construct a confidence interval for the difference between two population proportions p1-p2 by using the inequality below.

(p^1p^2)zcp^1q^1n1+p^2q^2n2<p1p2<(p^1p^2)+zcp^1q^1n1+p^2q^2n2(\(\hat{p}\)_1 - \(\hat{p}\)_2) - z_c \(\sqrt{\frac{\hat{p}\)_1 \(\hat{q}\)_1}{n_1} + \(\frac{\hat{p}\)_2 \(\hat{q}\)_2}{n_2}} < p_1 - p_2 < (\(\hat{p}\)_1 - \(\hat{p}\)_2) + z_c \(\sqrt{\frac{\hat{p}\)_1 \(\hat{q}\)_1}{n_1} + \(\frac{\hat{p}\)_2 \(\hat{q}\)_2}{n_2}}

In Exercises 23–26, construct the indicated confidence interval for p1-p2. Assume the samples are random and independent.


Students Planning to Study Visual and Performing Arts In a survey of 10,000 students taking the SAT, 7% were planning to study visual and performing arts in college. In another survey of 8000 students taken 10 years before, 8% were planning to study visual and performing arts in college. Construct a 95% confidence interval for p1-p2, where p1 is the proportion from the recent survey and p2 is the proportion from the survey taken 10 years ago. (Adapted from College Board)

101
views
교과서 질문

What conditions are necessary to use the z-test for testing the difference between two population proportions?

237
views
교과서 질문

Constructing Confidence Intervals for μ1-μ2, When the sampling distribution for x̅1-x̅2 is approximated by a t-distribution and the population variances are not equal, you can construct a confidence interval for μ1-μ2 , as shown below.

construct the indicated confidence interval for μ1-μ2 . Assume the populations are approximately normal with unequal variances.

10K Race

To compare the mean finishing times of male and female participants in a 10K race, you randomly select several finishing times from both sexes. The results are shown at the left. Construct an 80% confidence interval for the difference in mean finishing times of male and female participants in the race. (Adapted from Great Race)


75
views
교과서 질문

Test the claim about the mean of the differences for a population of paired data at the level of significance α. Assume the samples are random and dependent, and the populations are normally distributed.

Claim: μd≤0 , α=0.10, Sample statistics: d̄ =6.5, sd=9.54, n=16

77
views
교과서 질문

Gas Mileage The table shows the gas mileages (in miles per gallon) of eight cars with and without using a fuel additive. At α=0.10, is there enough evidence to conclude that the additive improved gas mileage? Assume the populations are normally distributed.


48
views