


Ch. 8 - Hypothesis Testing with Two Samples
Larson - Elementary Statistics: Picturing the World 8th Edition
Larson8th EditionElementary Statistics: Picturing the WorldISBN: 9780137493470당신이 사용하는 게 아니라요?교과서 변경
8장, 문제 8.1.16

Testing the Difference Between Two Means In Exercises 15–24, (a) identify the claim and state Ho and Ha, (b) find the critical value(s) and identify the rejection region(s), (c) find the standardized test statistic z, (d) decide whether to reject or fail to reject the null hypothesis, and (e) interpret the decision in the context of the original claim. Assume the samples are random and independent, and the populations are normally distributed.
Bed-in-a-Box To compare customer satisfaction with mattresses that are delivered compressed in a box and traditional mattresses, a researcher randomly selects 30 ratings of mattresses in boxes and 30 ratings of traditional mattresses. The mean rating of mattresses in boxes is 68.7 out of 100. Assume the population standard deviation is 6.6. The mean rating of traditional mattresses is 70.9 out of 100. Assume the population standard deviation is 5.6. At α=0.01, can the researcher support the claim that the mean rating of traditional mattresses is greater than the mean rating of mattresses in a box? (Adapted from Consumer Reports)

검증된 단계별 안내
1
Identify the claim and state the null hypothesis (H\_0) and alternative hypothesis (H\_a). Since the claim is that the mean rating of traditional mattresses is greater than that of mattresses in a box, set up: \(H_0: \mu_{traditional} \leq \mu_{box}\) \(H_a: \mu_{traditional} > \mu_{box}\)
Determine the significance level \(\alpha = 0.01\) and find the critical value for a right-tailed z-test. Use the standard normal distribution table to find the z-value such that the area to the right is 0.01. This z-value will define the rejection region where if the test statistic exceeds it, you reject \(H_0\).
Calculate the standardized test statistic \(z\) using the formula for the difference between two means with known population standard deviations: \(z = \frac{(\bar{x}_{traditional} - \bar{x}_{box}) - 0}{\sqrt{\frac{\sigma_{traditional}^2}{n_{traditional}} + \frac{\sigma_{box}^2}{n_{box}}}}\) where \(\bar{x}\) are the sample means, \(\sigma\) are the population standard deviations, and \(n\) are the sample sizes.
Compare the calculated \(z\) value to the critical value found in step 2. If \(z\) is greater than the critical value, reject the null hypothesis \(H_0\). Otherwise, fail to reject \(H_0\).
Interpret the decision in the context of the problem: If you rejected \(H_0\), conclude that there is sufficient evidence at the 0.01 significance level to support the claim that the mean rating of traditional mattresses is greater than that of mattresses in a box. If you failed to reject \(H_0\), conclude that there is not enough evidence to support the claim.

비슷한 문제에 대한 검증된 영상 답변:

이 영상 해법은 위 문제에 도움이 된다고 튜터들이 추천한 것입니다.
영상 길이:
7m
도움이 되었나요?

주요 개념

질문에 올바르게 답하기 위해 반드시 이해해야 하는 핵심 개념들은 다음과 같습니다.

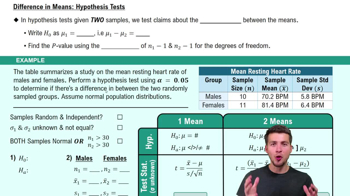
Hypothesis Testing for Two Means

This involves comparing the means of two independent populations to determine if there is a statistically significant difference. The null hypothesis (Ho) typically states that the means are equal, while the alternative hypothesis (Ha) reflects the claim, such as one mean being greater than the other. This framework guides the testing process.
추천 영상:
가이드 코스
08:24
Difference in Means: Hypothesis Tests

Critical Value and Rejection Region

The critical value is a threshold determined by the significance level (α) and the test type (one-tailed or two-tailed). It defines the rejection region, where if the test statistic falls within, the null hypothesis is rejected. For α=0.01 and a one-tailed test, the critical z-value marks the boundary for strong evidence against Ho.
추천 영상:
05:50
Critical Values: t-Distribution

Standardized Test Statistic (z-score)

The z-score measures how many standard errors the observed difference between sample means is from the hypothesized difference (usually zero). It is calculated using sample means, population standard deviations, and sample sizes. Comparing this z to the critical value helps decide whether to reject Ho.
추천 영상:
가이드 코스
07:09
Probability From Given Z-Scores - TI-84 (CE) Calculator
관련 실천
교과서 질문

Constructing Confidence Intervals for μd To construct a confidence interval for μd , use the inequality below.

Construct the indicated confidence interval for μd . Assume the populations are normally distributed.

[APPLET] Drug Testing A sleep disorder specialist wants to test the effectiveness of a new drug that is reported to increase the number of hours of sleep patients get during the night. To do so, the specialist randomly selects 16 patients and records the number of hours of sleep each gets with and without the new drug. The table shows the results of the two-night study. Construct a 90% confidence interval for μd.

103
views
교과서 질문

Test the claim about the difference between two population means and at the level of significance α. Assume the samples are random and independent, and the populations are normally distributed.

Claim: μ1=μ2, α=0.01, Assume (σ1)^2=(σ2)^2

Sample statistics:

x̅1=33.7, s1=3.5 , n1=12 and x̅2=35.5 , s2=2.2 , n2=17

118
views
교과서 질문

Constructing Confidence Intervals for μ1-μ2. When the sampling distribution for x̅1-x̅2 is approximated by a t-distribution and the populations have equal variances, you can construct a confidence interval for μ1-μ2, as shown below.

Construct the indicated confidence interval for μ1-μ2 . Assume the populations are approximately normal with equal variances.

Family Doctor 

To compare the mean number of days spent waiting to see a family doctor for two large cities, you randomly select several people in each city who have had an appointment with a family doctor. The results are shown at the left. Construct a 90% confidence interval for the difference in mean number of days spent waiting to see a family doctor for the two cities. (Adapted from Merritt Hawkins)

43
views
교과서 질문

Daily Activities In Exercises 19–22, the results of a survey of 200 U.S. randomly selected U.S. men and 300 randomly selected U.S. women are shown in the figure at the left, which displays the percentages engaged in working or socializing and communicating on an average day. (Adapted from U.S. Bureau of Labor Statistics)


Women’s Activities At α=0.01, can you reject the claim that the proportion of women who work is the same as the proportion of women who socialize and communicate on an average day?

75
views
교과서 질문

Testing the Difference Between Two Means In Exercises 15–24, (a) identify the claim and state Ho and Ha, (b) find the critical value(s) and identify the rejection region(s), (c) find the standardized test statistic z, (d) decide whether to reject or fail to reject the null hypothesis, and (e) interpret the decision in the context of the original claim. Assume the samples are random and independent, and the populations are normally distributed.

Home Prices A real estate agency says that the mean home sales price in Casper, Wyoming, is the same as in Cheyenne, Wyoming. The mean home sales price for 35 homes in Casper is \$349,237. Assume the population standard deviation is \$158,005. The mean home sales price for 41 homes in Cheyenne is \$435,244. Assume the population standard deviation is \$154,716. At α=0.01, is there enough evidence to reject the agency’s claim? (Adapted from Realtor.com)

36
views
교과서 질문

Testing the Difference Between Two Means In Exercises 15–24, (a) identify the claim and state Ho and Ha, (b) find the critical value(s) and identify the rejection region(s), (c) find the standardized test statistic z, (d) decide whether to reject or fail to reject the null hypothesis, and (e) interpret the decision in the context of the original claim. Assume the samples are random and independent, and the populations are normally distributed.

Repair Costs: Washing Machines You want to buy a washing machine, and a salesperson tells you that the mean repair costs for Model A and Model B are equal. You research the repair costs. The mean repair cost of 24 Model A washing machines is \$208. Assume the population standard deviation is \$18. The mean repair cost of 26 Model B washing machines is \$221. Assume the population standard deviation is \$22. At α=0.01, can you reject the salesperson’s claim?

72
views