Ch. 8 - Hypothesis Testing with Two Samples
Larson - Elementary Statistics: Picturing the World 8th Edition
Larson8th EditionElementary Statistics: Picturing the WorldISBN: 9780137493470당신이 사용하는 게 아니라요?교과서 변경
8장, 문제 8.3.1

What conditions are necessary to use the dependent samples t-test for the mean of the differences for a population of paired data?

검증된 단계별 안내
1
The dependent samples t-test (also known as the paired samples t-test) is used when comparing the means of two related groups. The first condition is that the data must consist of paired observations, meaning each data point in one group is uniquely matched to a data point in the other group (e.g., pre-test and post-test scores for the same individuals).
The second condition is that the differences between the paired observations (calculated as the difference between each pair) should be approximately normally distributed. This can be checked using a normality test (e.g., Shapiro-Wilk test) or by examining a histogram or Q-Q plot of the differences.
The third condition is that the data should be measured on an interval or ratio scale, meaning the differences between values are meaningful and consistent (e.g., test scores, weights, or times).
The fourth condition is that the sample of paired differences should be randomly selected from the population of interest to ensure the results are generalizable.
Finally, the sample size should be sufficiently large to provide reliable results. If the sample size is small, the normality assumption becomes more critical, and you may need to rely on robust statistical methods or transformations if normality is violated.

비슷한 문제에 대한 검증된 영상 답변:

이 영상 해법은 위 문제에 도움이 된다고 튜터들이 추천한 것입니다.
영상 길이:
1m
도움이 되었나요?

주요 개념

질문에 올바르게 답하기 위해 반드시 이해해야 하는 핵심 개념들은 다음과 같습니다.

Dependent Samples

Dependent samples, also known as paired samples, refer to data sets where the observations are related or matched in some way. This often occurs in before-and-after studies or when measuring the same subjects under different conditions. Understanding this concept is crucial for applying the dependent samples t-test, as it ensures that the analysis accounts for the inherent relationship between the paired observations.
추천 영상:
05:11
Sampling Distribution of Sample Proportion

Normality of Differences

For the dependent samples t-test to be valid, the differences between the paired observations should be approximately normally distributed. This assumption is important because the t-test relies on the properties of the normal distribution to make inferences about the population mean. If the sample size is large, the Central Limit Theorem may allow for some flexibility regarding this assumption.
추천 영상:
가이드 코스
03:17
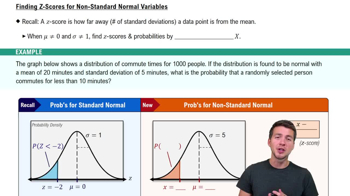
Finding Z-Scores for Non-Standard Normal Variables

Homogeneity of Variance

While the dependent samples t-test does not require the same homogeneity of variance assumption as independent samples t-tests, it is still important to consider the variability of the differences. The test assumes that the variance of the differences is constant across the pairs. If there is significant variability, it may affect the reliability of the test results, necessitating further investigation or alternative statistical methods.
추천 영상:
가이드 코스
05:27
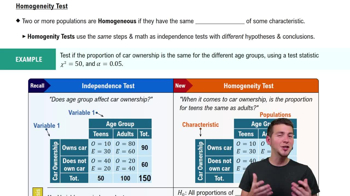
Homogeneity Test
관련 실천
교과서 질문

Testing the Difference Between Two Proportions In Exercises 7–12, (a) identify the claim and state Ho and Ha, (b) find the critical value(s) and identify the rejection region(s), (c) find the standardized test statistic z, (d) decide whether to reject or fail to reject the null hypothesis, and (e) interpret the decision in the context of the original claim. Assume the samples are random and independent.


Multiple Sclerosis Drug In a study to determine the effectiveness of using a drug to treat multiple sclerosis, 488 subjects were given the drug and 244 subjects were given a placebo. The numbers of subjects who had 12-week confirmed disability progression were tracked. The results are shown at the left. At α=0.01, can you support the claim that there is a difference in the proportion of subjects who had no 12-week confirmed disability progression? (Adapted from The New England Journal of Medicine)


70
views
교과서 질문

Constructing Confidence Intervals for μ1-μ2. You can construct a confidence interval for the difference between two population means μ1-μ2 , as shown below, when both population standard deviations are known, and either both populations are normally distributed or both n1>= 30 and n2>=30 . Also, the samples must be randomly selected and independent.

[Image]

In Exercises 29 and 30, construct the indicated confidence interval for μ1-μ2 .


Software Engineer Salaries Construct a 95% confidence interval for the difference between the mean annual salaries of entry level software engineers in Santa Clara, California, and Greenwich, CT, using the data from Exercise 27.

113
views
교과서 질문

[APPLET] Teaching Methods

Two teaching methods and their effects on science test scores are being reviewed. A group of students is taught in traditional lab sessions. A second group of students is taught using interactive simulation software. The science test scores for the two groups are shown in the back-to-back stem-and-leaf plot.

At , α=0.01 can you support the claim that the mean science test score is lower for students taught using the traditional lab method than it is for students taught using the interactive simulation software? Assume the population variances are equal.

61
views
교과서 질문

Young Adults In a survey of 3500 males ages 20 to 24 whose highest level of education is some college, but no bachelor’s degree, 80.2% were employed. In a survey of 2000 males ages 20 to 24 whose highest level of education is a bachelor’s degree or higher, 86.4% were employed. At α=0.01, can you support the claim that there is a difference in the proportion of those employed between the two groups? (Adapted from National Center for Education Statistics)

46
views
교과서 질문

Explain how to perform a two-sample z-test for the difference between two population means using independent samples with and known.

239
views
교과서 질문

"Testing the Difference Between Two Means In Exercises 15–24, (a) identify the claim and state Ho and Ha, (b) find the critical value(s) and identify the rejection region(s), (c) find the standardized test statistic z, (d) decide whether to reject or fail to reject the null hypothesis, and (e) interpret the decision in the context of the original claim. Assume the samples are random and independent, and the populations are normally distributed.

[APPLET] Precipitation A climatologist claims that the precipitation in Seattle, Washington, was greater than in Birmingham, Alabama, in a recent year. The daily precipitation amounts (in inches) for 30 days in a recent year in Seattle are shown below. Assume the population standard deviation is 0.25 inch.

0.00 0.00 0.05 0.01 0.21 0.00 0.00 0.52 0.00 0.010.00 0.19 0.00 0.18 0.02 0.02 0.13 0.00 0.03 0.000.04 0.00 0.41 0.23 0.00 0.80 0.15 0.00 0.00 0.79

The daily precipitation amounts (in inches) for 30 days in a recent year in Birmingham are shown below. Assume the population standard deviation is 0.52 inch.

0.00 0.96 0.84 0.00 0.10 0.00 0.00 0.20 0.00 0.54 0.97 0.00 0.35 0.02 0.04 0.70 0.00 0.00 0.00 0.00 0.03 0.01 0.15 0.27 0.00 0.00 0.93 0.00 0.89 0.01

At α=0.05, can you support the climatologist’s claim? (Source: NOAA)"

42
views