
교과서 질문
Two variables have a bivariate normal distribution. Explain what this means.
142
views

 검증된 단계별 안내

 06:14
06:14
 04:57
04:57 07:38
07:38Two variables have a bivariate normal distribution. Explain what this means.
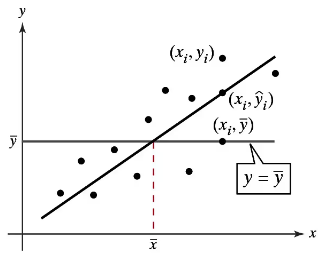
"In Exercises 7-12, match the description in the left column with its symbol(s) in the right column.
10. y-intercept
a. \(\hat{y}\)_i
b. y_i
c. b
d. (\(\bar{x}\), \(\bar{y}\))
e. m
f. \(\bar{y}\)"
"In Exercises 7-12, match the description in the left column with its symbol(s) in the right column.
7. The y-value of a data point corresponding to x;
a. \(\hat{y}\)_i
b. y_i
c. b
d. (\(\bar{x}\), \(\bar{y}\))
e. m
f. \(\bar{y}\)"
Graphical Analysis In Exercises 11–14, determine whether there is a perfect positive linear correlation, a strong positive linear correlation, a perfect negative linear correlation, a strong negative linear correlation, or no linear correlation between the variables.
"Constructing and Interpreting a Prediction Interval In Exercises 21-30, construct the indicated prediction interval and interpret the results.
21. Proceeds Construct a 95% prediction interval for the proceeds from initial public offerings in Exercise 11 when the number of offerings is 200."
"In Exercises 19-22, two variables are given that have been shown to have correlation but no cause-and-effect relationship. Describe at least one possible reason for the correlation.
21. Ice cream sales and homicide rates"