Ch. 1 - Introduction to Statistics
Triola - Elementary Statistics 14th Edition
Triola14th EditionElementary StatisticsISBN: 9780137366446당신이 사용하는 게 아니라요?교과서 변경
1장, 문제 1.C.6

Standard Deviation One way to get a very rough approximation of the value of a standard deviation of sample data is to find the range, then divide it by 4. The range is the difference between the highest sample value and the lowest sample value. In using this approach, what value is obtained from the sample data listed in Exercise 1 “IQ Scores”?

검증된 단계별 안내
1
Identify the highest and lowest values in the sample data set provided in Exercise 1 'IQ Scores'.
Calculate the range by subtracting the lowest value from the highest value in the sample data set.
Use the formula for the rough approximation of the standard deviation: divide the range by 4.
Range4
The result from the division gives a rough approximation of the standard deviation for the sample data.

비슷한 문제에 대한 검증된 영상 답변:

이 영상 해법은 위 문제에 도움이 된다고 튜터들이 추천한 것입니다.
영상 길이:
1m
도움이 되었나요?

주요 개념

질문에 올바르게 답하기 위해 반드시 이해해야 하는 핵심 개념들은 다음과 같습니다.

Standard Deviation

Standard deviation is a measure of the amount of variation or dispersion in a set of values. It quantifies how much the values in a dataset deviate from the mean, providing insight into the spread of the data. A low standard deviation indicates that the values tend to be close to the mean, while a high standard deviation suggests a wider range of values.
추천 영상:
가이드 코스
08:45
Calculating Standard Deviation

Range

The range is a simple measure of variability in a dataset, calculated as the difference between the highest and lowest values. It provides a quick sense of the spread of the data but does not account for the distribution of values between the extremes. While useful for a rough estimate, it can be sensitive to outliers.
추천 영상:
가이드 코스
05:45
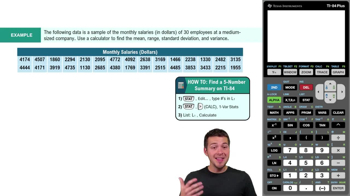
Find 5-Number Summary - TI-84 Calculator Example 1

Approximation Method for Standard Deviation

The approximation method for standard deviation involves dividing the range by 4 to estimate the standard deviation. This technique offers a quick, rough estimate, especially useful when detailed calculations are impractical. However, it assumes a normal distribution and may not be accurate for datasets with significant skewness or outliers.
추천 영상:
가이드 코스
08:45
Calculating Standard Deviation
관련 실천
교과서 질문

Physicians’ Health Study In the Physicians’ Health Study, some of the subjects were treated with aspirin while others were given a placebo. For the subjects in this experiment, what is blinding?

272
views

교과서 질문

Determining Sample Size The given expression is used to determine the size of the sample necessary to estimate the proportion of college students who have the profound wisdom to take a statistics course. Find the value and round the result up to the next larger whole number.


[(1.95996)^2 - 0.25] / (0.03)^2

327
views
교과서 질문

Body Temperature The given expression is used for determining the likelihood that the average (mean) human body temperature is different from the value of 98.6°F that is commonly used. Find the given value and round the result to two decimal places.


(98.2 - 98.6) / (0.62 / sqrt(106) )

303
views
교과서 질문

IQ Scores Listed below are the IQ scores of randomly selected statistics professors. What value is obtained when those IQ scores are added and the total is divided by the number of scores? (This result, called the mean, is discussed in Chapter 3.) What is notable about these values?


135 149 145 129 118 119 115 133 107 188

240
views
교과서 질문

Birth Weights For 100 randomly selected births from Bellevue Hospital Center, the birth weights are added and then divided by 100. The result is 3240 g. Is the value of 3240 g a statistic or a parameter?

294
views
교과서 질문

Birth Weights Refer to the sample described in Exercise 6. Because Bellevue Hospital Center agreed to provide the 100 birth weights, does the sample of birth weights constitute a voluntary response sample?

253
views