Ch. 10 - Correlation and Regression
Triola - Elementary Statistics 14th Edition
Triola14th EditionElementary StatisticsISBN: 9780137366446당신이 사용하는 게 아니라요?교과서 변경
10장, 문제 10.q.9

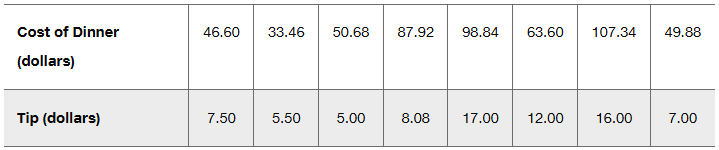
Exercises 1–10 are based on the following sample data consisting of costs of dinner (dollars) and the amounts of tips (dollars) left by diners. The data were collected by students of the author.
Table displaying costs of dinner and corresponding tips in dollars, with values for ten different diners.
Predictions Repeat the preceding exercise assuming that the linear correlation coefficient is r = 0.132.

검증된 단계별 안내
1
Step 1: Understand the problem. The goal is to analyze the relationship between the cost of dinner and the tip amount using the given data, assuming the linear correlation coefficient r = 0.132. This indicates a weak positive linear relationship between the two variables.
Step 2: Organize the data. The table provides pairs of values for the cost of dinner (independent variable, x) and the tip amount (dependent variable, y). These pairs will be used to calculate predictions based on the weak correlation.
Step 3: Use the formula for the equation of a regression line: y = mx + b, where m is the slope and b is the y-intercept. The slope m can be calculated using the formula: m = r * (sy / sx), where sy is the standard deviation of the tip amounts and sx is the standard deviation of the dinner costs.
Step 4: Calculate the y-intercept b using the formula: b = ȳ - m * x̄, where ȳ is the mean of the tip amounts and x̄ is the mean of the dinner costs. This will allow you to complete the regression equation.
Step 5: Use the regression equation to make predictions for the tip amounts based on the given dinner costs. Substitute each dinner cost into the equation y = mx + b to estimate the corresponding tip amount.

비슷한 문제에 대한 검증된 영상 답변:

이 영상 해법은 위 문제에 도움이 된다고 튜터들이 추천한 것입니다.
영상 길이:
1m
도움이 되었나요?

주요 개념

질문에 올바르게 답하기 위해 반드시 이해해야 하는 핵심 개념들은 다음과 같습니다.

Linear Correlation Coefficient (r)

The linear correlation coefficient, denoted as 'r', quantifies the strength and direction of a linear relationship between two variables. Its value ranges from -1 to 1, where 1 indicates a perfect positive correlation, -1 indicates a perfect negative correlation, and 0 indicates no correlation. In this context, an r value of 0.132 suggests a weak positive correlation between the cost of dinner and the amount of tip left.
추천 영상:
가이드 코스
05:43
Correlation Coefficient

Scatter Plot

A scatter plot is a graphical representation that displays the relationship between two quantitative variables. Each point on the plot corresponds to an observation in the dataset, with one variable plotted along the x-axis and the other along the y-axis. Analyzing the scatter plot can help visualize the correlation and identify any trends or patterns in the data, which is essential for interpreting the correlation coefficient.
추천 영상:
04:01
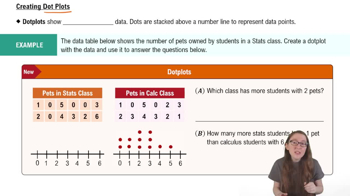
Creating Dotplots

Regression Analysis

Regression analysis is a statistical method used to model the relationship between a dependent variable and one or more independent variables. In this case, it could be used to predict the amount of tip based on the cost of dinner. The results of regression analysis can provide insights into how changes in the cost of dinner might affect the tips, allowing for better predictions and understanding of the data.
관련 실천
교과서 질문

Comparing Two Means Treating the data as samples from larger populations, test the claim that there is a significant difference between the mean of presidents and the mean of popes.

158
views

교과서 질문

Notation Using the weights (lb) and highway fuel consumption amounts (mi/gal) of the 48 cars listed in Data Set 35 “Car Data” of Appendix B, we get this regression equation:

y^ = 58.9 - 0.00749x, where x represents weight.

c. What is the predictor variable?

131
views
교과서 질문

Clusters Refer to the Minitab-generated scatterplot. The four points in the lower left corner are measurements from women, and the four points in the upper right corner are from men.

Find the value of the linear correlation coefficient using all eight points. What does that value suggest about the relationship between x and y?

165
views
교과서 질문

Sum of Squares Criterion In addition to the value of another measurement used to assess the quality of a model is the sum of squares of the residuals. Recall from Section 10-2 that a residual is (the difference between an observed y value and the value predicted from the model). Better models have smaller sums of squares. Refer to the U.S. population data in Table 10-7.

c. Verify that according to the sum of squares criterion, the quadratic model is better than the linear model.

44
views
교과서 질문

Testing for a Linear Correlation

In Exercises 13–28, construct a scatterplot, and find the value of the linear correlation coefficient r. Also find the P-value or the critical values of r from Table A-6. Use a significance level of α = 0.05. Determine whether there is sufficient evidence to support a claim of a linear correlation between the two variables. (Save your work because the same data sets will be used in Section 10-2 exercises.)

Powerball Jackpots and Tickets Sold Listed below are the same data from Table 10-1 in the Chapter Problem, but an additional pair of values has been added in the last column. Is there sufficient evidence to conclude that there is a linear correlation between lottery jackpot amounts and numbers of tickets sold? Comment on the effect of the added pair of values in the last column. Compare the results to those obtained in Example 4.


[IMAGE]

213
views