Ch. 11 - Goodness-of-Fit and Contingency Tables
Triola - Elementary Statistics 14th Edition
Triola14th EditionElementary StatisticsISBN: 9780137366446당신이 사용하는 게 아니라요?교과서 변경
11장, 문제 11.2.6

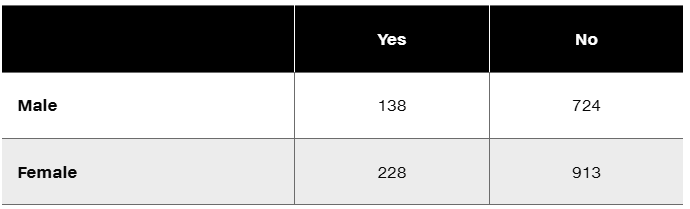
Ghosts The following table summarizes results from a Pew Research Center survey in which subjects were asked whether they had seen or been in the presence of a ghost. Use a 0.01 significance level to test the claim that gender is independent of response. Does the conclusion change if the significance level is changed to 0.05?


Survey table: Ghost sightings by gender. Males: Yes 138, No 724. Females: Yes 228, No 913.

검증된 단계별 안내
1
Step 1: Define the null and alternative hypotheses. The null hypothesis (H₀) states that gender is independent of the response (whether someone has seen or been in the presence of a ghost). The alternative hypothesis (H₁) states that gender is not independent of the response.
Step 2: Calculate the expected frequencies for each cell in the table using the formula: \( E = \frac{(\text{Row Total} \times \text{Column Total})}{\text{Grand Total}} \). For example, the expected frequency for Male-Yes is \( E = \frac{(862 \times 366)}{2003} \). Repeat this for all cells.
Step 3: Compute the chi-square test statistic using the formula: \( \chi^2 = \sum \frac{(O - E)^2}{E} \), where \( O \) is the observed frequency and \( E \) is the expected frequency. Perform this calculation for each cell and sum the results.
Step 4: Determine the degrees of freedom (df) using the formula: \( \text{df} = (\text{Number of Rows} - 1) \times (\text{Number of Columns} - 1) \). In this case, \( \text{df} = (2 - 1) \times (2 - 1) = 1 \). Use the chi-square distribution table to find the critical value at the 0.01 significance level and compare it to the test statistic.
Step 5: Repeat the comparison at the 0.05 significance level. If the test statistic exceeds the critical value at either significance level, reject the null hypothesis. Otherwise, fail to reject the null hypothesis. Interpret the results in the context of the problem.

비슷한 문제에 대한 검증된 영상 답변:

이 영상 해법은 위 문제에 도움이 된다고 튜터들이 추천한 것입니다.
영상 길이:
6m
도움이 되었나요?

주요 개념

질문에 올바르게 답하기 위해 반드시 이해해야 하는 핵심 개념들은 다음과 같습니다.

Chi-Square Test of Independence

The Chi-Square Test of Independence is a statistical method used to determine if there is a significant association between two categorical variables. In this case, it assesses whether gender (male or female) is independent of the response to the ghost sighting question (yes or no). The test compares the observed frequencies in each category to the expected frequencies if there were no association.
추천 영상:
가이드 코스
05:54
Probability of Multiple Independent Events

Significance Level (Alpha)

The significance level, often denoted as alpha (α), is the threshold for determining whether a result is statistically significant. Common levels are 0.01 and 0.05, indicating a 1% and 5% risk of concluding that a difference exists when there is none. Changing the significance level affects the likelihood of rejecting the null hypothesis, which in this case is that gender and ghost sightings are independent.
추천 영상:
가이드 코스
04:46
Step 4: State Conclusion Example 4

Null and Alternative Hypotheses

In hypothesis testing, the null hypothesis (H0) represents the default position that there is no effect or association, while the alternative hypothesis (H1) suggests that there is an effect or association. For this question, H0 posits that gender is independent of ghost sighting responses, while H1 suggests that there is a dependence between the two variables. The outcome of the test will either support or reject the null hypothesis based on the calculated p-value.
추천 영상:
가이드 코스
06:21
Step 1: Write Hypotheses
관련 실천
교과서 질문

Right-Tailed, Left-Tailed, Two-Tailed Is the hypothesis test described in Exercise 1 right-tailed, left-tailed, or two-tailed? Explain your choice.

304
views

교과서 질문

In Exercises 5–20, conduct the hypothesis test and provide the test statistic and the P-value and/or critical value, and state the conclusion.


Flat Tire and Missed Class A classic story involves four carpooling students who missed a test and gave as an excuse a flat tire. On the makeup test, the instructor asked the students to identify the particular tire that went flat. If they really didn’t have a flat tire, would they be able to identify the same tire? The author asked 41 other students to identify the tire they would select. The results are listed in the following table (except for one student who selected the spare). Use a 0.05 significance level to test the author’s claim that the results fit a uniform distribution. What does the result suggest about the likelihood of four students identifying the same tire when they really didn’t have a flat?


" style="" width="600">

109
views
교과서 질문

Accuracy of Fingerprint Identifications An experiment was conducted to compare the accuracy of fingerprint experts to the accuracy of novices (based on data from “Identifying Fingerprint Expertise,” by Tangen, Thompson, and McCarthy, Psychological Science, Vol. 22, No. 8). The data in the table are based on trials in which the evaluators were given matching fingerprints. Use a 0.05 significance level to determine whether correct identification is independent of whether the evaluator is an expert or a novice.


105
views
교과서 질문

Gender and Eye Color The following table describes the distribution of eye colors reported by male and female statistics students (based on data from “Does Eye Color Depend on Gender? It Might Depend on Who or How You Ask,” by Froelich and Stephenson, Journal of Statistics Education, Vol. 21, No. 2). Is there sufficient evidence to warrant rejection of the belief that gender and eye color are independent traits? Use a 0.01 significance level.


151
views
교과서 질문

In Exercises 5–20, conduct the hypothesis test and provide the test statistic and the P-value and/or critical value, and state the conclusion.


Heights Measured or Reported? A random sample of the last digits of heights (in.) of males from Data Set 4 “Measured and Reported” is summarized in the table below. Use these last digits to determine whether they occur with about the same frequency. Use a 0.05 significance level. Do the corresponding heights appear to be measured or reported?


" style="" width="600">

122
views