

Ch. 11 - Goodness-of-Fit and Contingency Tables
Triola - Elementary Statistics 14th Edition
Triola14th EditionElementary StatisticsISBN: 9780137366446당신이 사용하는 게 아니라요?교과서 변경
11장, 문제 11.q.6

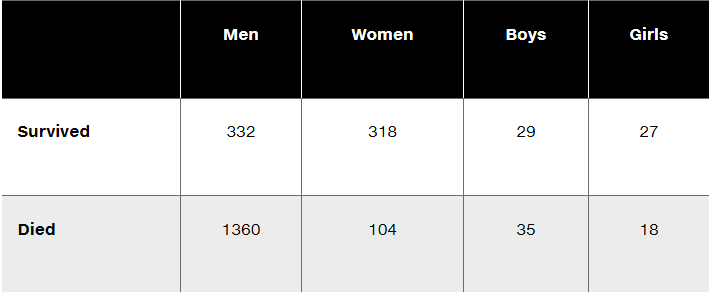
Questions 6–10 refer to the sample data in the following table, which describes the fate of the passengers and crew aboard the Titanic when it sank on April 15, 1912. Assume that the data are a sample from a large population and we want to use a 0.05 significance level to test the claim that surviving is independent of whether the person is a man, woman, boy, or girl.


Titanic survival data table: Men 332/1360, Women 318/104, Boys 29/35, Girls 27/18.


Identify the null and alternative hypotheses corresponding to the stated claim.

검증된 단계별 안내
1
Step 1: Understand the problem. The goal is to test the claim that survival on the Titanic is independent of the category of the person (man, woman, boy, or girl). This is a chi-square test for independence, as we are analyzing categorical data in a contingency table.
Step 2: Define the null hypothesis (H₀) and the alternative hypothesis (H₁). The null hypothesis (H₀) states that survival is independent of the category of the person. The alternative hypothesis (H₁) states that survival is not independent of the category of the person.
Step 3: Organize the data. The table provided shows the observed frequencies for each category (men, women, boys, girls) and their survival status (survived or died). These observed frequencies will be used to calculate the expected frequencies under the assumption of independence.
Step 4: Calculate the expected frequencies. Use the formula for expected frequency: E = (row total × column total) / grand total. For each cell in the table, calculate the expected frequency based on the row and column totals.
Step 5: Compute the chi-square test statistic. Use the formula χ² = Σ((O - E)² / E), where O is the observed frequency and E is the expected frequency. Sum this value across all cells in the table. Then compare the test statistic to the critical value from the chi-square distribution table with the appropriate degrees of freedom to determine whether to reject the null hypothesis.

비슷한 문제에 대한 검증된 영상 답변:

이 영상 해법은 위 문제에 도움이 된다고 튜터들이 추천한 것입니다.
영상 길이:
2m
도움이 되었나요?

주요 개념

질문에 올바르게 답하기 위해 반드시 이해해야 하는 핵심 개념들은 다음과 같습니다.

Null Hypothesis (H0)

The null hypothesis is a statement that indicates no effect or no difference in a given situation. In this context, it posits that survival is independent of gender or age group (men, women, boys, girls). This means that the proportion of survivors is the same across all categories, and any observed differences are due to random chance.
추천 영상:
가이드 코스
06:21
Step 1: Write Hypotheses

Alternative Hypothesis (H1)

The alternative hypothesis is a statement that contradicts the null hypothesis, suggesting that there is an effect or a difference. For this scenario, the alternative hypothesis asserts that survival is dependent on gender or age group, indicating that the proportions of survivors differ among men, women, boys, and girls.
추천 영상:
가이드 코스
06:21
Step 1: Write Hypotheses

Significance Level (α)

The significance level, often denoted as alpha (α), is the threshold for determining whether to reject the null hypothesis. In this case, a significance level of 0.05 means that there is a 5% risk of concluding that a difference exists when there is none. If the p-value obtained from the statistical test is less than 0.05, the null hypothesis would be rejected in favor of the alternative hypothesis.
추천 영상:
가이드 코스
04:46
Step 4: State Conclusion Example 4
관련 실천
교과서 질문

Questions 6–10 refer to the sample data in the following table, which describes the fate of the passengers and crew aboard the Titanic when it sank on April 15, 1912. Assume that the data are a sample from a large population and we want to use a 0.05 significance level to test the claim that surviving is independent of whether the person is a man, woman, boy, or girl.


Find the number of degrees of freedom.

99
views
교과서 질문

Exercises 1–5 refer to the sample data in the following table, which summarizes the frequencies of 500 digits randomly generated by Statdisk. Assume that we want to use a 0.05 significance level to test the claim that Statdisk generates the digits in a way that they are equally likely.


Is the hypothesis test left-tailed, right-tailed, or two-tailed?


85
views
교과서 질문

Questions 6–10 refer to the sample data in the following table, which describes the fate of the passengers and crew aboard the Titanic when it sank on April 15, 1912. Assume that the data are a sample from a large population and we want to use a 0.05 significance level to test the claim that surviving is independent of whether the person is a man, woman, boy, or girl.


What distribution is used to test the stated claim (normal, t, F, chi-square, uniform)?

126
views
교과서 질문

Questions 6–10 refer to the sample data in the following table, which describes the fate of the passengers and crew aboard the Titanic when it sank on April 15, 1912. Assume that the data are a sample from a large population and we want to use a 0.05 significance level to test the claim that surviving is independent of whether the person is a man, woman, boy, or girl.


Is the hypothesis test left-tailed, right-tailed, or two-tailed?

94
views