


Ch. 12 - Analysis of Variance
Triola - Elementary Statistics 14th Edition
Triola14th EditionElementary StatisticsISBN: 9780137366446당신이 사용하는 게 아니라요?교과서 변경
12장, 문제 12.1.11

In Exercises 5–16, use analysis of variance for the indicated test.


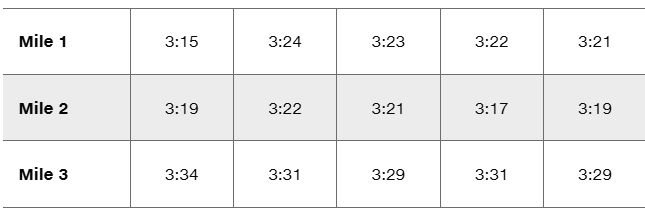
Triathlon Times Jeff Parent is a statistics instructor who participates in triathlons. Listed below are times (in minutes and seconds) he recorded while riding a bicycle for five stages through each mile of a 3-mile loop. Use a 0.05 significance level to test the claim that it takes the same time to ride each of the miles. Does one of the miles appear to have a hill?
Triathlon bike times table: Mile 1 (3:15-3:24), Mile 2 (3:17-3:22), Mile 3 (3:29-3:34).

검증된 단계별 안내
1
Step 1: Convert the times into a consistent numerical format (e.g., seconds). For example, 3:15 becomes 195 seconds, 3:24 becomes 204 seconds, and so on. This ensures all data is in a comparable format for analysis.
Step 2: Organize the data into groups based on the miles (Mile 1, Mile 2, Mile 3). Calculate the mean and variance for each group to summarize the data.
Step 3: Perform an Analysis of Variance (ANOVA) test. The null hypothesis (H0) is that the mean times for all three miles are equal, while the alternative hypothesis (H1) is that at least one mile has a different mean time. Use the formula for the F-statistic: F = (Between-group variance) / (Within-group variance).
Step 4: Compare the calculated F-statistic to the critical value from the F-distribution table at a significance level of 0.05. If the F-statistic exceeds the critical value, reject the null hypothesis.
Step 5: Interpret the results. If the null hypothesis is rejected, identify which mile has the significantly different mean time. This could indicate the presence of a hill or other factor affecting the time for that mile.

비슷한 문제에 대한 검증된 영상 답변:

이 영상 해법은 위 문제에 도움이 된다고 튜터들이 추천한 것입니다.
영상 길이:
3m
도움이 되었나요?

주요 개념

질문에 올바르게 답하기 위해 반드시 이해해야 하는 핵심 개념들은 다음과 같습니다.

Analysis of Variance (ANOVA)

ANOVA is a statistical method used to compare the means of three or more groups to determine if at least one group mean is significantly different from the others. It helps in assessing the impact of one or more factors by comparing the variance within groups to the variance between groups. In this case, it will be used to test if the average times for each mile differ significantly.
추천 영상:
가이드 코스
04:48
Variance & Standard Deviation of Discrete Random Variables

Significance Level

The significance level, often denoted as alpha (α), is the threshold for determining whether a result is statistically significant. A common significance level is 0.05, which indicates a 5% risk of concluding that a difference exists when there is none. In this exercise, using a 0.05 significance level means that if the p-value from the ANOVA test is less than 0.05, we reject the null hypothesis that all mile times are equal.
추천 영상:
가이드 코스
04:46
Step 4: State Conclusion Example 4

Null and Alternative Hypotheses

In hypothesis testing, the null hypothesis (H0) represents a statement of no effect or no difference, while the alternative hypothesis (H1) suggests that there is an effect or a difference. For this question, the null hypothesis would state that the mean times for all three miles are equal, while the alternative hypothesis would suggest that at least one mile has a different mean time, potentially indicating the presence of a hill.
추천 영상:
가이드 코스
06:21
Step 1: Write Hypotheses
관련 실천
교과서 질문

Two-Way Anova If we have a goal of using the data given in Exercise 1 to (1) determine whether the femur side (left, right) has an effect on the crash force measurements and (2) to determine whether the vehicle size has an effect on the crash force measurements, should we use one-way analysis of variance for the two individual tests? Why or why not?

169
views
교과서 질문

Distance Between Pupils The following table lists distances (mm) between pupils of randomly selected U.S. Army personnel collected as part of the ANSUR II study. Results from two-way analysis of variance are also shown. Use the displayed results and use a 0.05 significance level. What do you conclude? Are the results as you would expect?

132
views
교과서 질문

Pancake Experiment Listed below are ratings of pancakes made by experts (based on data from Minitab). Different pancakes were made with and without a supplement and with different amounts of whey. The results from two-way analysis of variance are shown. Use the displayed results and a 0.05 significance level. What do you conclude?

44
views
교과서 질문

In Exercises 1–4, use the following listed measured amounts of chest compression (mm) from car crash tests (from Data Set 35 “Car Data” in Appendix B). Also shown are the SPSS results from analysis of variance. Assume that we plan to use a 0.05 significance level to test the claim that the different car sizes have the same mean amount of chest compression.


Why Not Test Two at a Time? Refer to the sample data given in Exercise 1. If we want to test for equality of the four means, why don’t we use the methods of Section 9-2 “Two Means: Independent Samples” for the following six separate hypothesis tests?


110
views
교과서 질문

Balanced Design Does the table given in Exercise 1 constitute a balanced design? Why or why not?

130
views
교과서 질문

One-Way ANOVA In general, what is one-way analysis of variance used for?

245
views