

Ch. 12 - Analysis of Variance
Triola - Elementary Statistics 14th Edition
Triola14th EditionElementary StatisticsISBN: 9780137366446당신이 사용하는 게 아니라요?교과서 변경
12장, 문제 12.1.3b

Interaction


b. In general, when using two-way analysis of variance, if we find that there is an interaction effect, how does that affect the procedure?

검증된 단계별 안내
1
Understand the concept of interaction effect: In a two-way analysis of variance (ANOVA), an interaction effect occurs when the effect of one independent variable on the dependent variable depends on the level of the other independent variable. This means the two factors do not operate independently of each other.
Interpret the presence of an interaction effect: If an interaction effect is found to be statistically significant, it indicates that the relationship between the independent variables and the dependent variable is more complex and cannot be fully explained by the main effects alone.
Adjust the interpretation of main effects: When an interaction effect is present, the main effects of the independent variables should be interpreted with caution. The interaction may overshadow or modify the main effects, making it necessary to analyze the interaction in detail.
Modify the analysis procedure: To understand the interaction effect, you may need to perform additional post-hoc tests or create interaction plots. These steps help visualize and interpret how the levels of one factor influence the effect of the other factor on the dependent variable.
Report the findings: Clearly report the presence of the interaction effect in your results, along with any post-hoc analyses or visualizations. Emphasize how the interaction impacts the interpretation of the data and the conclusions drawn from the study.

비슷한 문제에 대한 검증된 영상 답변:

이 영상 해법은 위 문제에 도움이 된다고 튜터들이 추천한 것입니다.
영상 길이:
1m
도움이 되었나요?

주요 개념

질문에 올바르게 답하기 위해 반드시 이해해야 하는 핵심 개념들은 다음과 같습니다.

Two-Way ANOVA

Two-way analysis of variance (ANOVA) is a statistical method used to determine the effect of two independent variables on a dependent variable. It allows researchers to assess not only the main effects of each independent variable but also the interaction effects between them. This method is particularly useful when examining complex experimental designs where multiple factors may influence the outcome.
추천 영상:
가이드 코스
03:50
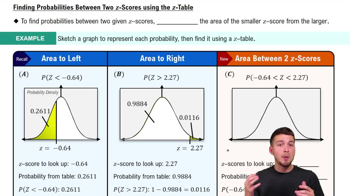
Probabilities Between Two Values

Interaction Effect

An interaction effect occurs when the effect of one independent variable on the dependent variable differs depending on the level of another independent variable. In the context of two-way ANOVA, finding a significant interaction suggests that the relationship between one factor and the outcome is influenced by the other factor. This complicates the interpretation of main effects, as the simple effects of each factor cannot be understood in isolation.
추천 영상:
가이드 코스
05:48
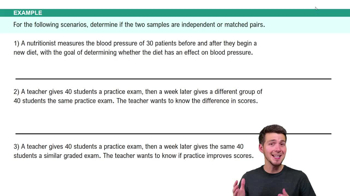
Introduction to Matched Pairs Example 1

Post Hoc Tests

Post hoc tests are statistical analyses conducted after an ANOVA to explore the differences between group means when significant effects are found. If an interaction effect is present, post hoc tests can help identify which specific groups differ from each other. These tests are essential for providing a deeper understanding of the data and clarifying the nature of the interaction observed in the analysis.
추천 영상:
가이드 코스
06:34
Step 2: Calculate Test Statistic
관련 실천
교과서 질문

Bonferroni Test Shown below are weights (kg) of poplar trees obtained from trees planted in a rich and moist region. The trees were given different treatments identified in the table below. The data are from a study conducted by researchers at Pennsylvania State University and were provided by Minitab, Inc. Also shown are partial results from using the Bonferroni test with the sample data.

c. Use the Bonferroni test procedure with a 0.05 significance level to test for a significant difference between the mean amount of the irrigation treatment group and the group treated with both fertilizer and irrigation. Identify the test statistic and either the P-value or critical values. What do the results indicate?

33
views
교과서 질문

Interaction


a. What is an interaction between two factors?


503
views
교과서 질문

In Exercises 1–4, use the following listed measured amounts of chest compression (mm) from car crash tests (from Data Set 35 “Car Data” in Appendix B). Also shown are the SPSS results from analysis of variance. Assume that we plan to use a 0.05 significance level to test the claim that the different car sizes have the same mean amount of chest compression.


Anova


b. If the objective is to test the claim that the four car sizes have the same mean chest compression, why is the method referred to as analysis of variance?

137
views
교과서 질문

Transformations of Data Example 1 illustrated the use of two-way ANOVA to analyze the sample data in Table 12-3. How are the results affected in each of the following cases?


a. The same constant is added to each sample value.

192
views
교과서 질문

Transformations of Data Example 1 illustrated the use of two-way ANOVA to analyze the sample data in Table 12-3. How are the results affected in each of the following cases?


b. Each sample value is multiplied by the same nonzero constant.

158
views
교과서 질문

Bonferroni Test Shown below are weights (kg) of poplar trees obtained from trees planted in a rich and moist region. The trees were given different treatments identified in the table below. The data are from a study conducted by researchers at Pennsylvania State University and were provided by Minitab, Inc. Also shown are partial results from using the Bonferroni test with the sample data.

b. What do the displayed Bonferroni SPSS results tell us?

43
views