Ch. 2 - Exploring Data with Tables and Graphs
Triola - Elementary Statistics 14th Edition
Triola14th EditionElementary StatisticsISBN: 9780137366446당신이 사용하는 게 아니라요?교과서 변경
2장, 문제 2.1.5

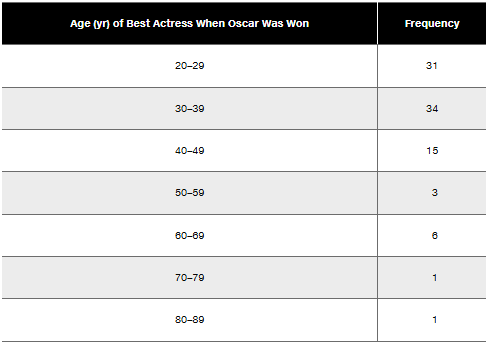
In Exercises 5–8, identify the class width, class midpoints, and class boundaries for the given frequency distribution. Also identify the number of individuals included in the summary. The frequency distributions are based on real data from Appendix B.
Table displaying age ranges of best actresses when they won Oscars, along with corresponding frequency counts.

검증된 단계별 안내
1
Step 1: Identify the class width. The class width is calculated by subtracting the lower boundary of one class from the lower boundary of the next class. For example, subtract 20 (lower boundary of the first class) from 30 (lower boundary of the second class).
Step 2: Calculate the class midpoints. The class midpoint is the average of the lower and upper boundaries of each class. For example, for the first class (20–29), calculate (20 + 29) / 2.
Step 3: Determine the class boundaries. The class boundaries are the values that separate one class from another without gaps. For example, for the first class (20–29), the lower boundary is 19.5 and the upper boundary is 29.5.
Step 4: Sum the frequencies to find the total number of individuals included in the summary. Add all the frequencies together: 31 + 34 + 15 + 3 + 6 + 1 + 1.
Step 5: Verify the calculations and ensure all values (class width, midpoints, boundaries, and total frequency) are consistent with the data provided in the frequency distribution table.

비슷한 문제에 대한 검증된 영상 답변:

이 영상 해법은 위 문제에 도움이 된다고 튜터들이 추천한 것입니다.
영상 길이:
5m
도움이 되었나요?

주요 개념

질문에 올바르게 답하기 위해 반드시 이해해야 하는 핵심 개념들은 다음과 같습니다.

Class Width

Class width refers to the range of values that each class interval covers in a frequency distribution. It is calculated by subtracting the lower boundary of a class from its upper boundary. For example, in the age distribution provided, the class width for the age range 20-29 is 10 years (29 - 20 = 9, plus one for inclusive counting).
추천 영상:
가이드 코스
05:18
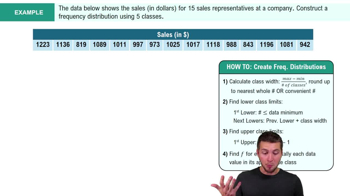
How to Create Frequency Distributions Example 2

Class Midpoint

The class midpoint is the value that lies in the middle of a class interval and is calculated by averaging the upper and lower boundaries of that class. For instance, the midpoint for the age range 20-29 is (20 + 29) / 2 = 24.5. This value is often used in statistical calculations, such as finding the mean of grouped data.
추천 영상:
04:15
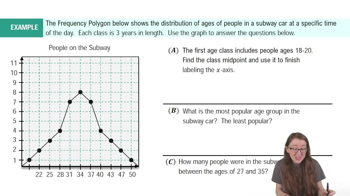
Frequency Polygons Example 1

Class Boundaries

Class boundaries are the values that separate one class from another in a frequency distribution. They are determined by taking the upper limit of one class and the lower limit of the next class, ensuring there are no gaps between classes. For example, the class boundaries for the age range 20-29 would be 19.5 (lower) and 29.5 (upper), allowing for a continuous range of data.
추천 영상:
가이드 코스
07:10
How to Create Histogram - TI-84 Calculator
관련 실천
교과서 질문

IQ Scores IQ scores of adults are normally distributed. If a large sample of adults is randomly selected and the IQ scores are illustrated in a histogram, what is the shape of that histogram?

251
views

교과서 질문

In Exercises 5 and 6, construct the dotplot.


Diastolic Blood Pressure Listed below are diastolic blood pressure measurements (mm Hg) of females selected from Data Set 1 “Body Data” in Appendix B. All of the values are even numbers. Are there any outliers? If so, identify their values.

102
views
교과서 질문

In Exercises 15 and 16, construct the frequency polygons.

Presidents Use the frequency distribution from Exercise 14 in Section 2-1 to construct a frequency polygon. Does the graph suggest that the distribution is skewed? If so, how?

151
views
교과서 질문

In Exercises 9–12, using a loose interpretation of the criteria for determining whether a frequency distribution is approximately a normal distribution, determine whether the given frequency distribution is approximately a normal distribution. Give a brief explanation.

Blood Platelet Counts of Females Refer to the frequency distribution from Exercise 8

126
views
교과서 질문

Causation A study has shown that there is a correlation between body weight and blood pressure. Higher body weights are associated with higher blood pressure levels. Can we conclude that gaining weight is a cause of increased blood pressure?

208
views
교과서 질문

In Exercises 5–8, answer the questions by referring to the following Minitab-generated histogram, which depicts the weights (grams) of all quarters listed in Data Set 40 “Coin Weights” in Appendix B. (Grams are actually units of mass and the values shown on the horizontal scale are rounded.)


Relative Frequency Histogram How would the shape of the histogram change if the vertical scale uses relative frequencies expressed in percentages instead of the actual frequency counts as shown here?

183
views