

Ch. 2 - Exploring Data with Tables and Graphs
Triola - Elementary Statistics 14th Edition
Triola14th EditionElementary StatisticsISBN: 9780137366446당신이 사용하는 게 아니라요?교과서 변경
2장, 문제 2.1.7

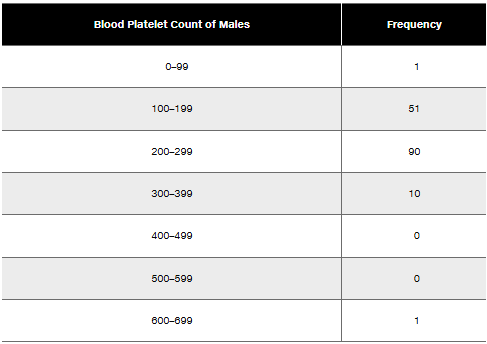
In Exercises 5–8, identify the class width, class midpoints, and class boundaries for the given frequency distribution. Also identify the number of individuals included in the summary. The frequency distributions are based on real data from Appendix B.
7.Table displaying blood platelet count ranges for males alongside their corresponding frequencies.

검증된 단계별 안내
1
Step 1: Identify the class width. The class width is calculated as the difference between the lower boundary of one class and the lower boundary of the next class. For example, the lower boundary of the first class is 0, and the lower boundary of the second class is 100. Therefore, the class width is 100.
Step 2: Calculate the class midpoints. The class midpoint is the average of the lower and upper boundaries of each class. For example, for the first class (0–99), the midpoint is calculated as (0 + 99) / 2 = 49.5. Repeat this calculation for all classes.
Step 3: Determine the class boundaries. The class boundaries are the values that separate one class from another without gaps. For example, the boundary between the first class (0–99) and the second class (100–199) is 99.5. Add 0.5 to the upper limit of each class and subtract 0.5 from the lower limit of each class to find all boundaries.
Step 4: Calculate the total number of individuals included in the summary. Add up all the frequencies provided in the table. For example, 1 + 51 + 90 + 10 + 0 + 0 + 1 = Total individuals.
Step 5: Verify the calculations and ensure all values (class width, midpoints, boundaries, and total individuals) are consistent with the frequency distribution provided in the table.

비슷한 문제에 대한 검증된 영상 답변:

이 영상 해법은 위 문제에 도움이 된다고 튜터들이 추천한 것입니다.
영상 길이:
6m
도움이 되었나요?

주요 개념

질문에 올바르게 답하기 위해 반드시 이해해야 하는 핵심 개념들은 다음과 같습니다.

Class Width

Class width refers to the range of values that each class interval covers in a frequency distribution. It is calculated by subtracting the lower boundary of a class from its upper boundary. For example, in the class interval 0-99, the class width is 99 - 0 = 99. Understanding class width is essential for accurately interpreting the distribution of data.
추천 영상:
가이드 코스
05:18
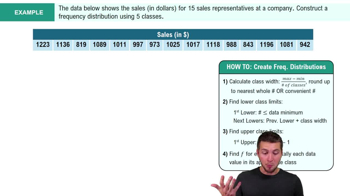
How to Create Frequency Distributions Example 2

Class Midpoint

The class midpoint is the value that lies in the middle of a class interval and is calculated by averaging the upper and lower boundaries of that interval. For instance, for the class 100-199, the midpoint is (100 + 199) / 2 = 149.5. Class midpoints are useful for summarizing data and performing further statistical analysis, such as calculating the mean.
추천 영상:
04:15
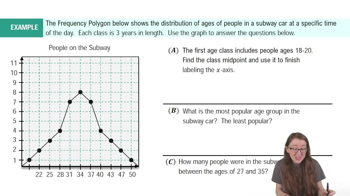
Frequency Polygons Example 1

Class Boundaries

Class boundaries are the values that separate one class interval from another in a frequency distribution. They are typically calculated by taking the average of the upper limit of one class and the lower limit of the next class. For example, the boundary between the classes 0-99 and 100-199 would be 99.5. Class boundaries help in accurately representing continuous data and avoiding gaps between classes.
추천 영상:
가이드 코스
07:10
How to Create Histogram - TI-84 Calculator
관련 실천
교과서 질문

In Exercises 13 and 14, construct the pie chart.


Box Office Boffo Use the data from Exercise 11 “Box Office Boffo.”

"Recent annual gross revenue (millions of dollars) for the leading movie studios are as follows: 20th Century Fox (1082), Buena Vista (3092), Paramount (757), Sony/Columbia (1304), Universal (1772), Warner Brothers (1941)."

162
views
교과서 질문

V and Digital Ads Listed below are amounts (billions of dollars) spent on TV and digital advertising. The amounts are listed in order by year ending with the year 2022. The last few years are projected amounts (based on data from Magna Global). Construct a graph that reveals the story that the data are trying to tell. What story does the graph depict?

TV Ads:

[Image]

105
views
교과서 질문

Freshman 15 Refer to Data Set 13 “Freshman 15” and use the second column, which lists weights (kg) in September of college freshmen. Begin with a lower class limit of 40 kg and use a class width of 10 kg. Does the distribution appear to be a normal distribution?

168
views
교과서 질문

Analysis of Last Digits Weights of respondents were recorded as part of the California Health Interview Survey. The last digits of weights from 50 randomly selected respondents are listed below. Construct a frequency distribution with 10 classes. Based on the distribution, do the weights appear to be reported or actually measured? Does there appear to be a gap in the frequencies and, if so, how might that gap be explained? What do you know about the accuracy of the results?

126
views
교과서 질문

Births Natural births randomly selected from four hospitals in New York State occurred on the days of the week (in the order of Monday through Sunday) with these frequencies: 52, 66, 72, 57, 57, 43, 53. Does it appear that such births occur on the days of the week with equal frequency?

202
views
교과서 질문

Ethics There are data showing that smoking is detrimental to good health. Given that people could be helped and lives could be saved by reducing smoking, is it ethical to graph the data in a way that is misleading by exaggerating the health risks of smoking?

124
views