Ch. 2 - Exploring Data with Tables and Graphs
Triola - Elementary Statistics 14th Edition
Triola14th EditionElementary StatisticsISBN: 9780137366446당신이 사용하는 게 아니라요?교과서 변경
2장, 문제 2.4.10

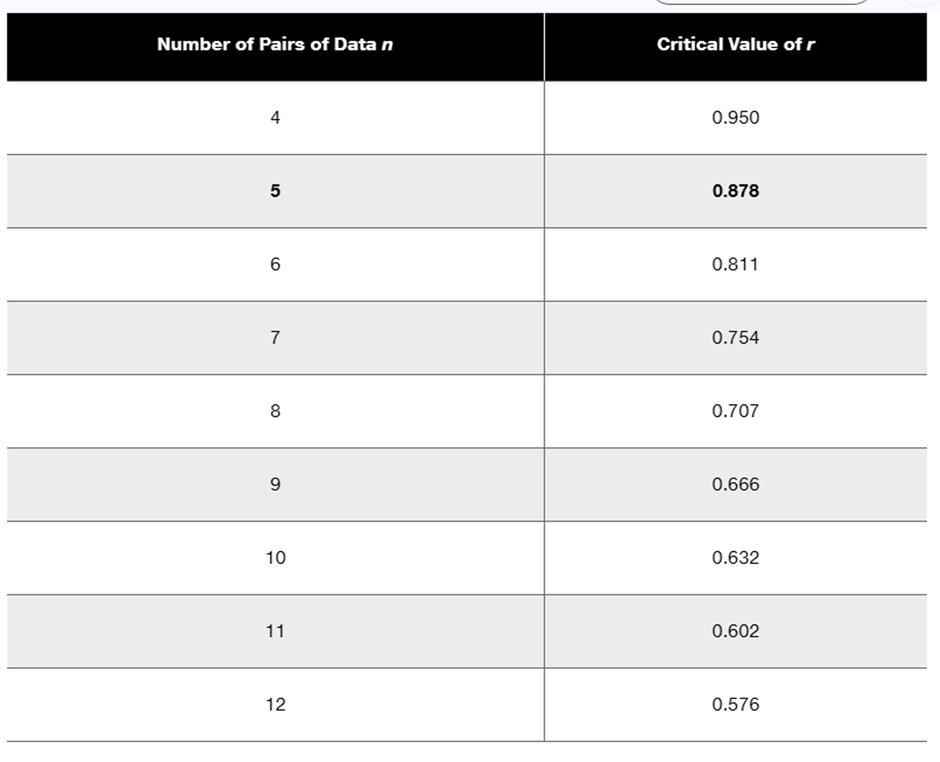
Use Table 2-11 to find the critical values of r. Based on a comparison of the linear correlation coefficient r and the critical values, what do you conclude about a linear correlation?
Using the data from Exercise 6 “Airport Data Speeds,” the linear correlation coefficient is r = 0.866
Table comparing data values for Sprint and Verizon, showing numerical statistics across various categories.
Table displaying critical values of r based on the number of data pairs, with values ranging from 0.576 to 0.950.

검증된 단계별 안내
1
Step 1: Count the number of pairs of data (n) in the dataset provided. Each pair consists of one value from Sprint and one value from Verizon. In the table, there are 8 pairs of data.
Step 2: Refer to Table 2-11 to find the critical value of r for n = 8. From the table, the critical value of r for n = 8 is 0.707.
Step 3: Compare the given linear correlation coefficient r = 0.866 with the critical value of r = 0.707. If the absolute value of r is greater than the critical value, there is significant evidence of a linear correlation.
Step 4: Since r = 0.866 is greater than the critical value of 0.707, conclude that there is a significant linear correlation between the Sprint and Verizon data speeds.
Step 5: Interpret the result: The significant linear correlation suggests that as one variable (e.g., Sprint data speed) increases, the other variable (e.g., Verizon data speed) tends to increase as well, indicating a positive relationship.

비슷한 문제에 대한 검증된 영상 답변:

이 영상 해법은 위 문제에 도움이 된다고 튜터들이 추천한 것입니다.
영상 길이:
3m
도움이 되었나요?

주요 개념

질문에 올바르게 답하기 위해 반드시 이해해야 하는 핵심 개념들은 다음과 같습니다.

Linear Correlation Coefficient (r)

The linear correlation coefficient, denoted as r, quantifies the strength and direction of a linear relationship between two variables. Its value ranges from -1 to 1, where 1 indicates a perfect positive correlation, -1 indicates a perfect negative correlation, and 0 indicates no correlation. In this context, an r value of 0.866 suggests a strong positive correlation between the data sets being analyzed.
추천 영상:
가이드 코스
05:43
Correlation Coefficient

Critical Values of r

Critical values of r are threshold values that determine the significance of the correlation coefficient in hypothesis testing. These values depend on the sample size and the chosen significance level (commonly 0.05). By comparing the calculated r value to the critical values, one can conclude whether the observed correlation is statistically significant or likely due to random chance.
추천 영상:
05:50
Critical Values: t-Distribution

Statistical Significance

Statistical significance indicates whether the results observed in a study are likely to be genuine or if they could have occurred by random chance. In the context of correlation, if the calculated r exceeds the critical value for a given sample size, the correlation is considered statistically significant, implying that there is a reliable relationship between the variables being studied.
추천 영상:
가이드 코스
05:53
Parameters vs. Statistics
관련 실천
교과서 질문

IQ Scores IQ scores of adults are normally distributed. If a large sample of adults is randomly selected and the IQ scores are illustrated in a histogram, what is the shape of that histogram?

251
views

교과서 질문

In Exercises 17–20, identify how the graph is deceptive.


Cost of Giving Birth According to the Agency for Healthcare Research and Quality Healthcare Cost and Utilization Project, the typical cost of a C-section baby delivery is \$4500, and the typical cost of a vaginal delivery is \$2600. See the following illustration.


128
views
교과서 질문

In Exercises 9 and 10, construct the time-series graph.


Home Runs Listed below are the numbers of home runs in Major League Baseball for each year beginning with 1993 (listed in order by row). Is there a trend?

117
views
교과서 질문

In Exercises 5 and 6, construct the dotplot.


Diastolic Blood Pressure Listed below are diastolic blood pressure measurements (mm Hg) of females selected from Data Set 1 “Body Data” in Appendix B. All of the values are even numbers. Are there any outliers? If so, identify their values.

102
views
교과서 질문

In Exercises 15 and 16, construct the frequency polygons.

Presidents Use the frequency distribution from Exercise 14 in Section 2-1 to construct a frequency polygon. Does the graph suggest that the distribution is skewed? If so, how?

151
views
교과서 질문

In Exercises 9–18, construct the histograms and answer the given questions.


Analysis of Last Digits Use the frequency distribution from Exercise 21 in Section 2-1 to construct a histogram. What can be concluded from the distribution of the digits? Specifically, do the heights appear to be reported or actually measured?

142
views