Ch. 3 - Describing, Exploring, and Comparing Data
Triola - Elementary Statistics 14th Edition
Triola14th EditionElementary StatisticsISBN: 9780137366446당신이 사용하는 게 아니라요?교과서 변경
3장, 문제 3.2.38

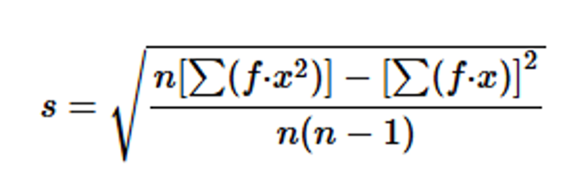
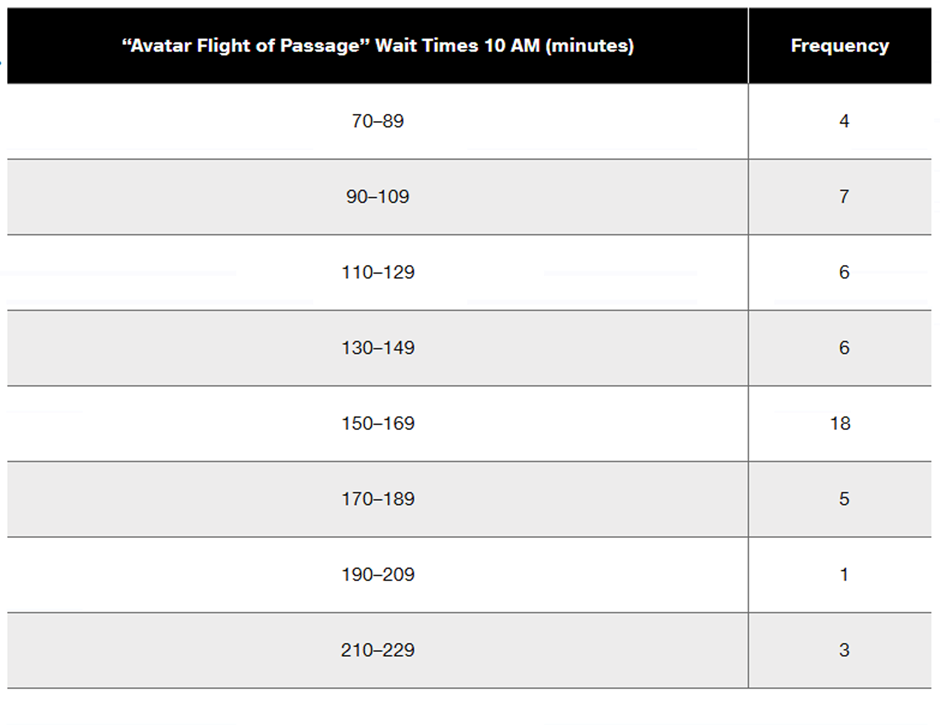
Finding Standard Deviation from a Frequency Distribution. In Exercises 37–40, refer to the frequency distribution in the given exercise and compute the standard deviation by using the formula below, where x represents the class midpoint, f represents the class frequency, and n represents the total number of sample values. Also, compare the computed standard deviations to these standard deviations obtained by using Formula 3-4 with the original list of data values: (Exercise 37) 18.5 minutes; (Exercise 38) 36.7 minutes; (Exercise 39) 6.9 years; (Exercise 40) 20.4 seconds.


Standard deviation for frequency distribution
Formula for calculating standard deviation from a frequency distribution, showing variables and mathematical notation.


Table displaying wait times in minutes for "Avatar Flight of Passage" with corresponding frequencies for each time range.

검증된 단계별 안내
1
Step 1: Calculate the class midpoints for each class interval. The midpoint is found by averaging the lower and upper boundaries of each class interval. For example, for the interval 70–89, the midpoint is (70 + 89) / 2 = 79.5.
Step 2: Multiply each class midpoint by its corresponding frequency to calculate the product f * x for each class. Then, sum all these products to find Σ(f * x).
Step 3: Square each class midpoint to calculate x², then multiply each squared midpoint by its corresponding frequency to calculate f * x² for each class. Sum all these products to find Σ(f * x²).
Step 4: Compute the total number of sample values, n, by summing all the frequencies. For example, n = Σ(f).
Step 5: Use the formula for the standard deviation: s = sqrt((n * Σ(f * x²) - (Σ(f * x))²) / (n * (n - 1))). Substitute the values of n, Σ(f * x), and Σ(f * x²) into the formula to calculate the standard deviation.

비슷한 문제에 대한 검증된 영상 답변:

이 영상 해법은 위 문제에 도움이 된다고 튜터들이 추천한 것입니다.
영상 길이:
7m
도움이 되었나요?

주요 개념

질문에 올바르게 답하기 위해 반드시 이해해야 하는 핵심 개념들은 다음과 같습니다.

Standard Deviation

Standard deviation is a measure of the amount of variation or dispersion in a set of values. It quantifies how much the values in a dataset deviate from the mean. A low standard deviation indicates that the values tend to be close to the mean, while a high standard deviation indicates a wider spread of values.
추천 영상:
가이드 코스
08:45
Calculating Standard Deviation

Frequency Distribution

A frequency distribution is a summary of how often each value occurs in a dataset. It organizes data into classes or intervals, showing the number of observations (frequency) within each class. This helps in understanding the distribution of data points and is essential for calculating statistics like the mean and standard deviation.
추천 영상:
가이드 코스
06:38
Intro to Frequency Distributions

Class Midpoint

The class midpoint is the value that lies in the middle of a class interval in a frequency distribution. It is calculated by averaging the upper and lower boundaries of the class. Class midpoints are used in the calculation of the standard deviation for grouped data, as they represent the data points within each interval.
추천 영상:
04:15
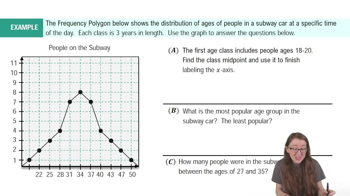
Frequency Polygons Example 1
관련 실천
교과서 질문

In Exercises 21–28, use the same list of cell phone radiation levels given for Exercises 17–20. Find the indicated percentile or quartile.


Q3


149
views

교과서 질문

Mean Absolute Deviation Use the same population of {9 cigarettes, 10 cigarettes, 20 cigarettes} from Exercise 45. Show that when samples of size 2 are randomly selected with replacement, the samples have mean absolute deviations that do not center about the value of the mean absolute deviation of the population. What does this indicate about a sample mean absolute deviation being used as an estimator of the mean absolute deviation of a population?

188
views
교과서 질문

Boxplots. In Exercises 29–32, use the given data to construct a boxplot and identify the 5-number summary.


Blood Pressure Measurements Fourteen different second-year medical students at Bellevue Hospital measured the blood pressure of the same person. The systolic readings (mm Hg) are listed below.


138 130 135 140 120 125 120 130 130 144 143 140 130 150

197
views
교과서 질문

z Scores If your score on your next statistics test is converted to a z score, which of these z scores would you prefer: -2.00, -1.00, 0, 1.00, 2.00? Why?

319
views
교과서 질문

Why Divide by ? Let a population consist of the values 9 cigarettes, 10 cigarettes, and 20 cigarettes smoked in a day (based on data from the California Health Interview Survey). Assume that samples of two values are randomly selected with replacement from this population. (That is, a selected value is replaced before the second selection is made.)


a. Find the variance of the population {9 cigarettes, 10 cigarettes, 20 cigarettes}.

143
views
교과서 질문

In Exercises 5–20, find the range, variance, and standard deviation for the given sample data. Include appropriate units (such as “minutes”) in your results. (The same data were used in Section 3-1, where we found measures of center. Here we find measures of variation.) Then answer the given questions.


Super Bowl Ages Listed below are the ages of the same 11 players used in the preceding exercise. How are the resulting statistics fundamentally different from those found in the preceding exercise?


41 24 30 31 32 29 25 26 26 25 30

299
views