



Ch. 5 - Discrete Probability Distributions
Triola - Elementary Statistics 14th Edition
Triola14th EditionElementary StatisticsISBN: 9780137366446당신이 사용하는 게 아니라요?교과서 변경
5장, 문제 5.c.8

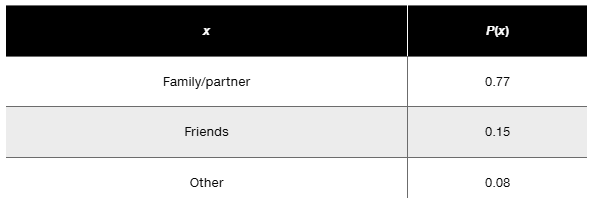
Happiness In a survey sponsored by Coca-Cola, subjects were asked what contributes most to their happiness, and the table summarizes their responses. Does the table represent a probability distribution? Explain.


Table showing happiness contributors: Family/partner 0.77, Friends 0.15, Other 0.08. Total probability is 1.00.

검증된 단계별 안내
1
Step 1: Understand the requirements for a probability distribution. A probability distribution must satisfy two conditions: (1) The sum of all probabilities must equal 1, and (2) each individual probability must be between 0 and 1, inclusive.
Step 2: Examine the table provided. The table lists the categories (Family/partner, Friends, Other) and their corresponding probabilities (P(x)): 0.77, 0.15, and 0.08.
Step 3: Verify condition (1). Add the probabilities together: \( P(x) = 0.77 + 0.15 + 0.08 \). Check if the sum equals 1.
Step 4: Verify condition (2). Check each probability value to ensure it is between 0 and 1. Specifically, confirm that \( 0 \leq 0.77 \leq 1 \), \( 0 \leq 0.15 \leq 1 \), and \( 0 \leq 0.08 \leq 1 \).
Step 5: Based on the results of steps 3 and 4, determine whether the table represents a valid probability distribution. If both conditions are satisfied, the table is a probability distribution; otherwise, it is not.

비슷한 문제에 대한 검증된 영상 답변:

이 영상 해법은 위 문제에 도움이 된다고 튜터들이 추천한 것입니다.
영상 길이:
2m
도움이 되었나요?

주요 개념

질문에 올바르게 답하기 위해 반드시 이해해야 하는 핵심 개념들은 다음과 같습니다.

Probability Distribution

A probability distribution describes how the probabilities of a random variable are distributed across its possible values. For a valid probability distribution, the sum of all probabilities must equal 1, and each individual probability must be between 0 and 1. In the context of the survey, the table lists the probabilities associated with different contributors to happiness.
추천 영상:
가이드 코스
06:39
Calculating Probabilities in a Binomial Distribution

Total Probability

Total probability refers to the sum of all probabilities in a probability distribution. It is a crucial aspect to verify if a set of probabilities forms a valid distribution. In the given table, the total probability is calculated by adding the probabilities of Family/partner (0.77), Friends (0.15), and Other (0.08), which equals 1.00, confirming that it meets the criteria for a probability distribution.
추천 영상:
5:37
Introduction to Probability

Random Variable

A random variable is a variable whose possible values are numerical outcomes of a random phenomenon. In this case, the random variable represents different contributors to happiness, such as Family/partner, Friends, and Other. Each contributor has an associated probability, indicating the likelihood of it being a significant factor in the respondents' happiness.
추천 영상:
가이드 코스
07:09
Intro to Random Variables & Probability Distributions
관련 실천
교과서 질문

In Exercises 25–28, find the probabilities and answer the questions.


Too Young to Tat Based on a Harris poll, among adults who regret getting tattoos, 20% say that they were too young when they got their tattoos. Assume that five adults who regret getting tattoos are randomly selected, and find the indicated probability.


c. Find the probability that the number of selected adults saying they were too young is 0 or 1.


218
views
교과서 질문

Tennis Challenge In a recent U.S. Open tennis tournament, there were 945 challenges made by singles players, and 255 of them resulted in referee calls that were overturned. The accompanying table lists the results by gender.


e. If one of the challenges is randomly selected, find the probability that it was made by a man, given that the challenge was upheld with an overturned call.

96
views
교과서 질문

In Exercises 29 and 30, assume that different groups of couples use the XSORT method of gender selection and each couple gives birth to one baby. The XSORT method is designed to increase the likelihood that a baby will be a girl, but assume that the method has no effect, so the probability of a girl is 0.5.


Gender Selection Assume that the groups consist of 36 couples.


c. Is the result of 26 girls a result that is significantly high? What does it suggest about the effectiveness of the XSORT method?

153
views
교과서 질문

In Exercises 31 and 32, assume that hybridization experiments are conducted with peas having the property that for offspring, there is a 0.75 probability that a pea has green pods (as in one of Mendel’s famous experiments).


Hybrids Assume that offspring peas are randomly selected in groups of 16.


c. Is a result of 7 peas with green pods a result that is significantly low? Why or why not?

147
views
교과서 질문

Planets The planets of the solar system have the numbers of moons listed below in order from the sun. (Pluto is not included because it was uninvited from the solar system party in 2006.) Include appropriate units whenever relevant.


0 0 1 2 17 28 21 8


e. Find the standard deviation.

f. Find the variance.


139
views
교과서 질문

Salary Negotiations In a Jobvite survey, 2287 adult workers were randomly selected and asked about salary negotiations.


a. 29% of the respondents reported that they negotiated salary at their latest job. What is the number of respondents who reported that they negotiated salary?

90
views