



Ch. 5 - Discrete Probability Distributions
Triola - Elementary Statistics 14th Edition
Triola14th EditionElementary StatisticsISBN: 9780137366446당신이 사용하는 게 아니라요?교과서 변경
5장, 문제 5.1.24

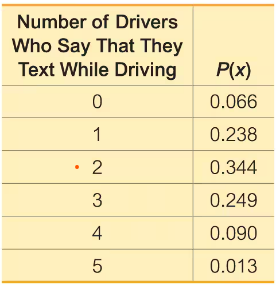
Texting and Driving. In Exercises 21–26, refer to the accompanying table, which describes probabilities for groups of five drivers. The random variable x is the number of drivers in a group who say that they text while driving (based on data from an Arity survey of drivers).
Table showing probabilities of 0 to 5 drivers texting while driving, with P(x) values from 0.066 to 0.013.
Using Probabilities for Significant Events


a. Find the probability of getting exactly 3 drivers who say that they text while driving.

검증된 단계별 안내
1
Step 1: Understand the problem. The random variable x represents the number of drivers in a group of five who say they text while driving. The table provides the probabilities P(x) for each possible value of x (from 0 to 5). We are tasked with finding the probability of exactly 3 drivers who say they text while driving.
Step 2: Locate the relevant probability in the table. To find the probability of exactly 3 drivers, look for the row where the number of drivers is 3. The corresponding probability P(3) is provided in the table.
Step 3: Interpret the table. From the table, the probability P(3) is listed as 0.249. This value represents the likelihood of having exactly 3 drivers in the group who text while driving.
Step 4: Verify the context. Ensure that the table is based on valid data and that the probabilities sum to 1, as this confirms the table represents a valid probability distribution.
Step 5: Conclude the process. The probability of getting exactly 3 drivers who say they text while driving is directly obtained from the table as P(3). No further calculations are needed since the value is explicitly provided.

비슷한 문제에 대한 검증된 영상 답변:

이 영상 해법은 위 문제에 도움이 된다고 튜터들이 추천한 것입니다.
영상 길이:
3m
도움이 되었나요?

주요 개념

질문에 올바르게 답하기 위해 반드시 이해해야 하는 핵심 개념들은 다음과 같습니다.

Random Variable

A random variable is a numerical outcome of a random phenomenon. In this context, the random variable x represents the number of drivers in a group of five who report texting while driving. Understanding random variables is crucial for analyzing probabilities and making inferences about the data collected.
추천 영상:
가이드 코스
07:09
Intro to Random Variables & Probability Distributions

Probability Distribution

A probability distribution describes how probabilities are assigned to each possible value of a random variable. The table provided shows the probability distribution for the random variable x, indicating the likelihood of 0 to 5 drivers texting while driving. This distribution is essential for calculating specific probabilities, such as the probability of exactly 3 drivers texting.
추천 영상:
가이드 코스
06:39
Calculating Probabilities in a Binomial Distribution

Calculating Probabilities

Calculating probabilities involves determining the likelihood of a specific event occurring based on the probability distribution. For this question, to find the probability of exactly 3 drivers texting while driving, one would refer to the table and identify the corresponding P(x) value, which is 0.249. This process is fundamental in statistics for making predictions and decisions based on data.
추천 영상:
가이드 코스
07:09
Probability From Given Z-Scores - TI-84 (CE) Calculator
관련 실천
교과서 질문

40% of consumers believe that cash will be obsolete in the next 20 years (based on a survey by J.P. Morgan Chase). In each of Exercises 15–20, assume that 8 consumers are randomly selected. Find the indicated probability.


Find the probability that at least 6 of the selected consumers believe that cash will be obsolete in the next 20 years.

147
views
교과서 질문

Identifying Discrete and Continuous Random Variables. In Exercises 5 and 6, refer to the given values, then identify which of the following is most appropriate: discrete random variable, continuous random variable, or not a random variable.


a. IQ scores of statistics students

b. Exact heights of statistics students

c. Shoe sizes (such as 8 or 8½) of statistics students

d. Majors (such as history) of statistics students

e. The number of rolls of a die required for a statistics student to get the number 4

263
views
교과서 질문

Exercises 33 and 34 involve the method of composite sampling, whereby a medical testing laboratory saves time and money by combining blood samples for tests so that only one test is conducted for several people. A combined sample tests positive if at least one person has the disease. If a combined sample tests positive, then individual blood tests are used to identify the individual with the disease or disorder.


HIV It is estimated that in the United States, the proportion of people infected with the human immunodeficiency virus (HIV) is 0.00343. In tests for HIV, blood samples from 50 different people are combined. What is the probability that the combined sample tests positive for HIV? Is it unlikely for such a combined sample to test positive?

128
views
교과서 질문

Stem Cell Survey In a Newsweek poll of 882 adults, 481 (or 55%) said that they were in favor of using federal tax money to fund medical research using stem cells obtained from human embryos. A politician claims that people don’t really understand the stem cell issue and their responses to such questions are random responses equivalent to a coin toss. Use the following probabilities related to determining whether the result of 481 is significantly high (assuming the true rate is 50%). Is 481 significantly high? What should be concluded about the politician’s claim? Explain.


P(respondent says to use the federal tax money) = 0.5

P(among 882, exactly 481 says to use federal tax money) = 0.000713

P(among 882,481 or more say to use federal tax money) = 0.00389

112
views
교과서 질문

In Exercises 5–12, determine whether the given procedure results in a binomial distribution or a distribution that can be treated as binomial (by applying the 5% guideline for cumbersome calculations). For those that are not binomial and cannot be treated as binomial, identify at least one requirement that is not satisfied.


Pew Survey In a Pew Research Center survey of 3930 subjects, the ages of the respondents are recorded.

212
views
교과서 질문

In Exercises 5–12, determine whether the given procedure results in a binomial distribution or a distribution that can be treated as binomial (by applying the 5% guideline for cumbersome calculations). For those that are not binomial and cannot be treated as binomial, identify at least one requirement that is not satisfied.


In a Pew Research Center survey, 3930 subjects were asked if they have ever fired a gun, and the responses consist of “yes” or “no.”

280
views