



Ch. 5 - Discrete Probability Distributions
Triola - Elementary Statistics 14th Edition
Triola14th EditionElementary StatisticsISBN: 9780137366446당신이 사용하는 게 아니라요?교과서 변경
5장, 문제 24b

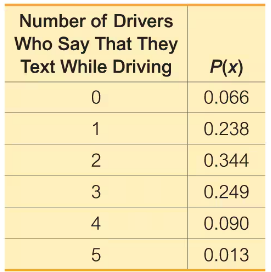
Texting and Driving. In Exercises 21–26, refer to the accompanying table, which describes probabilities for groups of five drivers. The random variable x is the number of drivers in a group who say that they text while driving (based on data from an Arity survey of drivers).
tab1
Using Probabilities for Significant Events


b. Find the probability of getting 3 or more drivers who say that they text while driving.

검증된 단계별 안내
1
Step 1: Understand the problem. We are tasked with finding the probability of getting 3 or more drivers who say they text while driving. This means we need to calculate P(x ≥ 3), where x is the number of drivers in a group who text while driving.
Step 2: Use the complement rule to simplify the calculation. The complement of P(x ≥ 3) is P(x < 3). Therefore, P(x ≥ 3) = 1 - P(x < 3).
Step 3: Calculate P(x < 3) by summing the probabilities for x = 0, x = 1, and x = 2. From the table, these probabilities are P(0) = 0.066, P(1) = 0.238, and P(2) = 0.344.
Step 4: Add the probabilities for x = 0, x = 1, and x = 2 to find P(x < 3). This will give the total probability of having fewer than 3 drivers who text while driving.
Step 5: Subtract P(x < 3) from 1 to find P(x ≥ 3). This will give the probability of having 3 or more drivers who text while driving.

비슷한 문제에 대한 검증된 영상 답변:

이 영상 해법은 위 문제에 도움이 된다고 튜터들이 추천한 것입니다.
영상 길이:
2m
도움이 되었나요?

주요 개념

질문에 올바르게 답하기 위해 반드시 이해해야 하는 핵심 개념들은 다음과 같습니다.

Random Variable

A random variable is a numerical outcome of a random phenomenon. In this context, the random variable x represents the number of drivers in a group of five who report texting while driving. Understanding random variables is crucial for analyzing probabilities and making inferences about populations based on sample data.
추천 영상:
가이드 코스
07:09
Intro to Random Variables & Probability Distributions

Probability Distribution

A probability distribution describes how probabilities are assigned to each possible value of a random variable. The table provided shows the probability distribution for the random variable x, indicating the likelihood of 0 to 5 drivers texting while driving. This distribution is essential for calculating probabilities of specific outcomes, such as finding the probability of 3 or more drivers texting.
추천 영상:
가이드 코스
06:39
Calculating Probabilities in a Binomial Distribution

Cumulative Probability

Cumulative probability refers to the probability that a random variable takes on a value less than or equal to a certain number. To find the probability of getting 3 or more drivers who text while driving, one must calculate the cumulative probabilities for 0, 1, and 2 drivers and subtract this sum from 1. This concept is vital for understanding how to aggregate probabilities for ranges of outcomes.
추천 영상:
5:37
Introduction to Probability
관련 실천
교과서 질문

 In Exercises 5–8, assume that the Poisson distribution applies; assume that the mean number of Atlantic hurricanes in the United States is 5.5 per year, as in Example 1; and proceed to find the indicated probability.


Hurricanes


b. In a 118-year period, how many years are expected to have no hurricanes?

130
views
교과서 질문

Texting and Driving. In Exercises 21–26, refer to the accompanying table, which describes probabilities for groups of five drivers. The random variable x is the number of drivers in a group who say that they text while driving (based on data from an Arity survey of drivers).

For groups of five drivers, find the mean and standard deviation for the numbers of drivers who say that they text while driving.

82
views
교과서 질문

Texting and Driving. In Exercises 21–26, refer to the accompanying table, which describes probabilities for groups of five drivers. The random variable x is the number of drivers in a group who say that they text while driving (based on data from an Arity survey of drivers).

Using Probabilities for Significant Events

d. Is 3 a significantly high number of drivers who say that they text while driving? Why or why not?

89
views
교과서 질문

Texting and Driving. In Exercises 21–26, refer to the accompanying table, which describes probabilities for groups of five drivers. The random variable x is the number of drivers in a group who say that they text while driving (based on data from an Arity survey of drivers).

Range Rule of Thumb for Significant Events

Use the range rule of thumb to determine whether 1 is a significantly low number of drivers who say that they text while driving.

107
views