

Ch. 6 - Normal Probability Distributions
Triola - Elementary Statistics 14th Edition
Triola14th EditionElementary StatisticsISBN: 9780137366446당신이 사용하는 게 아니라요?교과서 변경
6장, 문제 6.CRE.4

Blue Eyes Assume that 35% of us have blue eyes (based on a study by Dr. P. Soria at Indiana University).


b. Find the value of P(B_bar).

검증된 단계별 안내
1
Step 1: Understand the problem. The problem involves finding the complement probability of the event B, where B represents the event that a person has blue eyes. The complement of an event, denoted as B̅, represents the event that a person does NOT have blue eyes.
Step 2: Recall the complement rule in probability. The complement rule states that the probability of the complement of an event is given by: P(B̅) = 1 - P(B).
Step 3: Identify the given probability. From the problem, we are told that P(B) = 0.35, which is the probability that a person has blue eyes.
Step 4: Substitute the given value into the complement rule formula. Using the formula P(B̅) = 1 - P(B), substitute P(B) = 0.35 to calculate P(B̅).
Step 5: Simplify the expression. Perform the subtraction to find the value of P(B̅), which represents the probability that a person does NOT have blue eyes.

비슷한 문제에 대한 검증된 영상 답변:

이 영상 해법은 위 문제에 도움이 된다고 튜터들이 추천한 것입니다.
영상 길이:
2m
도움이 되었나요?

주요 개념

질문에 올바르게 답하기 위해 반드시 이해해야 하는 핵심 개념들은 다음과 같습니다.

Complementary Probability

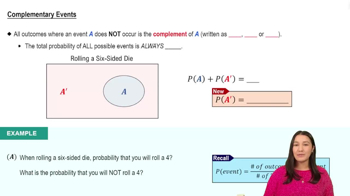
Complementary probability refers to the likelihood of an event not occurring. If the probability of an event A happening is P(A), then the probability of A not happening, denoted as P(A'), is calculated as P(A') = 1 - P(A). In this case, if 35% of people have blue eyes, the probability of not having blue eyes is the complement of this percentage.
추천 영상:
4:23
Complementary Events

Probability Notation

Probability notation is a standardized way to express the likelihood of events. In this context, P(B) represents the probability of event B occurring, while P(B_bar) or P(B') denotes the probability of event B not occurring. Understanding this notation is crucial for interpreting and solving probability problems accurately.
추천 영상:
5:37
Introduction to Probability

Basic Probability Calculation

Basic probability calculation involves determining the likelihood of an event based on known data. For example, if 35% of a population has blue eyes, the calculation for the probability of not having blue eyes (P(B_bar)) involves subtracting the given percentage from 100%. This fundamental skill is essential for solving various statistical problems.
추천 영상:
5:37
Introduction to Probability
관련 실천
교과서 질문

In Exercises 1 and 2, use the following wait times (minutes) at 10:00 AM for the Tower of Terror ride at Disney World (from Data Set 33 “Disney World Wait Times” in Appendix B).


35 35 20 50 95 75 45 50 30 35 30 30


b. Construct a boxplot.

138
views
교과서 질문

In Exercises 1 and 2, use the following wait times (minutes) at 10:00 AM for the Tower of Terror ride at Disney World (from Data Set 33 “Disney World Wait Times” in Appendix B).


35 35 20 50 95 75 45 50 30 35 30 30


d. The accompanying normal quantile plot is obtained by using all 50 wait times at 10:00 AM for the Tower of Terror ride at Disney World. Based on this normal quantile plot, do the sample data appear to be from a normally distributed population?

147
views
교과서 질문

Blue Eyes Assume that 35% of us have blue eyes (based on a study by Dr. P. Soria at Indiana University).


c. Find the probability of randomly selecting three different people and finding that all of them have blue eyes.

130
views
교과서 질문

In Exercises 1 and 2, use the following wait times (minutes) at 10:00 AM for the Tower of Terror ride at Disney World (from Data Set 33 “Disney World Wait Times” in Appendix B).


35 35 20 50 95 75 45 50 30 35 30 30


e. Convert the longest wait time to a z score.

f. Based on the result from part (e), is the longest wait time significantly high?

112
views
교과서 질문

In Exercises 1 and 2, use the following wait times (minutes) at 10:00 AM for the Tower of Terror ride at Disney World (from Data Set 33 “Disney World Wait Times” in Appendix B).


35 35 20 50 95 75 45 50 30 35 30 30


a. Find the mean xbar.

106
views
교과서 질문

Foot Lengths of Women Assume that foot lengths of adult females are normally distributed with a mean of 246.3 mm and a standard deviation of 12.4 mm (based on Data Set 3 “ANSUR II 2012” in Appendix B).


d. Find the probability that 16 adult females have foot lengths with a mean greater than 250 mm.

108
views