


Ch. 7 - Estimating Parameters and Determining Sample Sizes
Triola - Elementary Statistics 14th Edition
Triola14th EditionElementary StatisticsISBN: 9780137366446당신이 사용하는 게 아니라요?교과서 변경
7장, 문제 7.2.10

Atkins Weight Loss Program In a test of weight loss programs, 40 adults used the Atkins weight loss program. After 12 months, their mean weight loss was found to be 2.1 lb, with a standard deviation of 4.8 lb. Construct a 90% confidence interval estimate of the mean weight loss for all such subjects. Does the Atkins program appear to be effective? Does it appear to be practical?

검증된 단계별 안내
1
Step 1: Identify the key components of the problem. The sample size (n) is 40, the sample mean (x̄) is 2.1 lb, the sample standard deviation (s) is 4.8 lb, and the confidence level is 90%. Since the sample size is greater than 30, we can use the t-distribution to construct the confidence interval.
Step 2: Determine the critical t-value for a 90% confidence level. To do this, calculate the degrees of freedom (df = n - 1 = 40 - 1 = 39) and use a t-distribution table or statistical software to find the t-value corresponding to a 90% confidence level (two-tailed).
Step 3: Calculate the standard error of the mean (SE). The formula for the standard error is: SE = sn, where s is the sample standard deviation and n is the sample size.
Step 4: Construct the confidence interval using the formula: ± tα/2 × SE. Plug in the values for the sample mean (x̄), the critical t-value, and the standard error (SE) to calculate the lower and upper bounds of the confidence interval.
Step 5: Interpret the results. If the confidence interval includes 0, it suggests that the mean weight loss might not be significantly different from 0, meaning the program may not be effective. Additionally, consider whether the mean weight loss (2.1 lb) is practically significant in the context of weight loss goals.

비슷한 문제에 대한 검증된 영상 답변:

이 영상 해법은 위 문제에 도움이 된다고 튜터들이 추천한 것입니다.
영상 길이:
6m
도움이 되었나요?

주요 개념

질문에 올바르게 답하기 위해 반드시 이해해야 하는 핵심 개념들은 다음과 같습니다.

Confidence Interval

A confidence interval is a range of values, derived from sample statistics, that is likely to contain the true population parameter. In this case, it estimates the mean weight loss for all adults using the Atkins program. The width of the interval reflects the uncertainty around the estimate, and a 90% confidence level indicates that if the same procedure were repeated multiple times, 90% of the intervals would contain the true mean.
추천 영상:
06:33
Introduction to Confidence Intervals

Standard Deviation

Standard deviation is a measure of the amount of variation or dispersion in a set of values. In the context of the Atkins program, a standard deviation of 4.8 lb indicates that individual weight losses varied significantly around the mean of 2.1 lb. A high standard deviation suggests that while some participants may have lost a lot of weight, others may have lost very little or none at all, impacting the overall effectiveness of the program.
추천 영상:
가이드 코스
08:45
Calculating Standard Deviation

Effectiveness and Practicality

Effectiveness refers to how well a program achieves its intended outcome—in this case, weight loss. Practicality considers whether the program can be realistically followed by individuals in their daily lives. Evaluating the Atkins program involves analyzing the mean weight loss and its confidence interval to determine if the results are statistically significant and if the weight loss is substantial enough to be considered practical for long-term adherence.
추천 영상:
가이드 코스
05:48
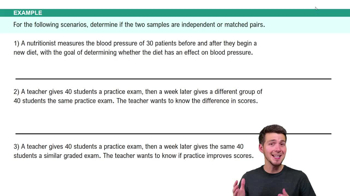
Introduction to Matched Pairs Example 1
관련 실천
교과서 질문

In Exercises 5–8, (a) identify the critical value ta/2 used for finding the margin of error, (b) find the margin of error, (c) find the confidence interval estimate of u, and (d) write a brief statement that interprets the confidence interval.


Pepsi Weights Here are summary statistics for the weights of Pepsi in randomly selected cans: n=36, x=0.82410 lb, s=0.00570 lb (based on Data Set 37 “Cola Weights and Volumes” in Appendix B). Use a confidence level of 99%.

217
views
교과서 질문

Constructing and Interpreting Confidence Intervals. In Exercises 13–16, use the given sample data and confidence level. In each case, (a) find the best point estimate of the population proportion p; (b) identify the value of the margin of error E; (c) construct the confidence interval; (d) write a statement that correctly interprets the confidence interval.


Medical Malpractice In a study of 1228 randomly selected medical malpractice lawsuits, it was found that 856 of them were dropped or dismissed (based on data from the Physicians Insurers Association of America). Construct a 95% confidence interval for the proportion of medical malpractice lawsuits that are dropped or dismissed.

181
views
교과서 질문

Formats of Confidence Intervals. In Exercises 9–12, express the confidence interval using the indicated format. (The confidence intervals are based on the proportions of red, orange, yellow, and blue M&Ms in Data Set 38 “Candies” in Appendix B.)


Green M&Ms Express 0.116 < p < 0.192 in the form of p +-E.

167
views
교과서 질문

Constructing and Interpreting Confidence Intervals. In Exercises 13–16, use the given sample data and confidence level. In each case, (a) find the best point estimate of the population proportion p; (b) identify the value of the margin of error E; (c) construct the confidence interval; (d) write a statement that correctly interprets the confidence interval.


Eliquis The drug Eliquis (apixaban) is used to help prevent blood clots in certain patients. In clinical trials, among 5924 patients treated with Eliquis, 153 developed the adverse reaction of nausea (based on data from Bristol-Myers Squibb Co.). Construct a 99% confidence interval for the proportion of adverse reactions.

198
views
교과서 질문

Job Interviews In a Harris poll of 514 human resource professionals, 463 said that the appearance of a job applicant is most important for a good first impression. Use 1000 bootstrap samples to construct a 99% confidence interval estimate of the proportion of all human resource professionals believing that the appearance of a job applicant is most important for a good first impression. How does the result compare to the confidence interval found in Exercise 24 part (b) in Section 7-1?

68
views
교과서 질문

Minting Quarters Listed below are weights (grams) of quarters minted after 1964 (based on Data Set 40 “Coin Weights” in Appendix B). Construct a 95% confidence interval estimate of the mean weight of all quarters minted after 1964. Specifications require that the quarters have a weight of 5.670 g. What does the confidence interval suggest about that specification?


100
views