Ch. 7 - Estimating Parameters and Determining Sample Sizes
Triola - Elementary Statistics 14th Edition
Triola14th EditionElementary StatisticsISBN: 9780137366446당신이 사용하는 게 아니라요?교과서 변경
7장, 문제 7.1.26

Critical Thinking. In Exercises 17–28, use the data and confidence level to construct a confidence interval estimate of p, then address the given question.


Gender Selection Before its clinical trials were discontinued, the Genetics & IVF Institute conducted a clinical trial of the XSORT method designed to increase the probability of conceiving a girl and, among the 945 babies born to parents using the XSORT method, there were 879 girls. The YSORT method was designed to increase the probability of conceiving a boy and, among the 291 babies born to parents using the YSORT method, there were 239 boys. Construct the two 95% confidence interval estimates of the percentages of success. Compare the results. What do you conclude?

검증된 단계별 안내
1
Step 1: Identify the problem and the data provided. For the XSORT method, we are given 945 total births and 879 girls. For the YSORT method, we are given 291 total births and 239 boys. The goal is to construct two 95% confidence intervals for the proportions of success (girls for XSORT and boys for YSORT).
Step 2: Calculate the sample proportions (p̂) for each method. For XSORT, the sample proportion is p̂ = 879 / 945. For YSORT, the sample proportion is p̂ = 239 / 291. These proportions represent the observed success rates for each method.
Step 3: Use the formula for the confidence interval for a population proportion: CI = p̂ ± Z * sqrt((p̂ * (1 - p̂)) / n), where Z is the critical value for a 95% confidence level (Z ≈ 1.96), p̂ is the sample proportion, and n is the sample size. Apply this formula separately for XSORT and YSORT.
Step 4: Plug in the values for XSORT. Use p̂ = 879 / 945 and n = 945. Calculate the margin of error (ME) using ME = Z * sqrt((p̂ * (1 - p̂)) / n). Then, compute the confidence interval as [p̂ - ME, p̂ + ME].
Step 5: Repeat the process for YSORT. Use p̂ = 239 / 291 and n = 291. Calculate the margin of error (ME) and the confidence interval as [p̂ - ME, p̂ + ME]. Finally, compare the two confidence intervals to determine if there is a significant difference in the success rates of the two methods.

비슷한 문제에 대한 검증된 영상 답변:

이 영상 해법은 위 문제에 도움이 된다고 튜터들이 추천한 것입니다.
영상 길이:
6m
도움이 되었나요?

주요 개념

질문에 올바르게 답하기 위해 반드시 이해해야 하는 핵심 개념들은 다음과 같습니다.

Confidence Interval

A confidence interval is a range of values, derived from sample statistics, that is likely to contain the true population parameter with a specified level of confidence, typically expressed as a percentage. For example, a 95% confidence interval suggests that if the same sampling method were repeated multiple times, approximately 95% of the calculated intervals would contain the true parameter. This concept is crucial for estimating proportions, such as the success rates of the XSORT and YSORT methods in this question.
추천 영상:
06:33
Introduction to Confidence Intervals

Proportion

A proportion is a statistical measure that represents the part of a whole, often expressed as a fraction or percentage. In the context of this question, the proportions of girls born using the XSORT method and boys born using the YSORT method are essential for calculating the confidence intervals. Understanding how to calculate and interpret these proportions is vital for comparing the effectiveness of the two methods.
추천 영상:
가이드 코스
09:27
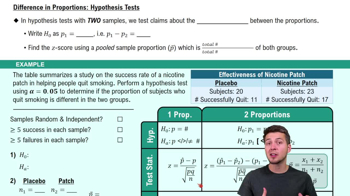
Difference in Proportions: Hypothesis Tests

Statistical Comparison

Statistical comparison involves analyzing two or more groups to determine if there are significant differences between them. In this case, comparing the confidence intervals of the XSORT and YSORT methods allows us to assess whether the methods significantly differ in their success rates for gender selection. This concept is important for drawing conclusions based on the data and understanding the implications of the results.
추천 영상:
가이드 코스
05:53
Parameters vs. Statistics
관련 실천
교과서 질문

Female Motorcycle Owners Here is a 95% confidence interval estimate of the percentage of motorcycle owners who are female: 17.5%<p<20.6% (based on data from the Motorcycle Industry Council). What is the best point estimate of the percentage of motorcycle owners who are women?

113
views
교과서 질문

Sample Size for Mean Find the sample size required to estimate the mean IQ of airline pilots. Assume that we want 99% confidence that the mean from the sample is within two IQ points of the true population mean. Also assume that sigma=15

178
views
교과서 질문

Red Blood Cell Count Here is a 95% confidence interval estimate of obtained by using the red blood cell counts of adult females listed in Data Set 1 “Body Data” in Appendix B:

[Image].

Identify the corresponding confidence interval estimate of and include the appropriate units.

149
views
교과서 질문

FINDING SAMPLE SIZE Instead of using Table 7-2 for determining the sample size required to estimate a population standard deviation σ, the following formula can also be used


n=12(zα/2d)2n=\(\frac{1}{2}\]\left\)(\(\frac{z_{\alpha/2}\)}{d}\(\right\))^2


where zα/2z_{_{}\(\alpha\)/2} corresponds to the confidence level and d is the decimal form of the percentage error. For example, to be 95% confident that s is within 15% of the value of σ, use zα/2=1.96 and d=0.15 to get a sample size of n=86. Find the sample size required to estimate the standard deviation of IQ scores of data scientists, assuming that we want 98% confidence that s is within 5% of σ.

140
views
교과서 질문

Job Interviews In a Harris poll of 514 human resource professionals, 463 said that the appearance of a job applicant is most important for a good first impression. Use 1000 bootstrap samples to construct a 99% confidence interval estimate of the proportion of all human resource professionals believing that the appearance of a job applicant is most important for a good first impression. How does the result compare to the confidence interval found in Exercise 24 part (b) in Section 7-1?

68
views
교과서 질문

Determining Sample Size. Assume that each sample is a simple random sample obtained from a normally distributed population.


You want to estimate for the population of diastolic blood pressures of air traffic controllers in the United States. Find the minimum sample size needed to be 95% confident that the sample standard deviation s is within 1% of σ. Is this sample size practical?

233
views