


Ch. 7 - Estimating Parameters and Determining Sample Sizes
Triola - Elementary Statistics 14th Edition
Triola14th EditionElementary StatisticsISBN: 9780137366446당신이 사용하는 게 아니라요?교과서 변경
7장, 문제 1a

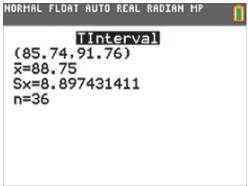
In Exercises 1–4, refer to the accompanying screen display that results from a simple random sample of times (minutes) between eruptions of the Old Faithful geyser. The confidence level of 95% was used.
calc
Refer to the accompanying screen display.


a. Express the confidence interval in the format that uses the “less than” symbol. Round the confidence interval limits given that the original times are all rounded to one decimal place.

검증된 단계별 안내
1
Identify the confidence interval limits from the screen display. The confidence interval is given as (85.74, 91.76).
Express the confidence interval in the format using the 'less than' symbol. This means rewriting it as: 85.74 < μ < 91.76, where μ represents the population mean.
Round the confidence interval limits to one decimal place, as specified in the problem. In this case, the limits are already rounded to one decimal place: 85.7 and 91.8.
Rewrite the rounded confidence interval in the 'less than' format: 85.7 < μ < 91.8.
Verify that the format and rounding are consistent with the problem's requirements, ensuring clarity and correctness in the final expression.

비슷한 문제에 대한 검증된 영상 답변:

이 영상 해법은 위 문제에 도움이 된다고 튜터들이 추천한 것입니다.
영상 길이:
2m
도움이 되었나요?

주요 개념

질문에 올바르게 답하기 위해 반드시 이해해야 하는 핵심 개념들은 다음과 같습니다.

Confidence Interval

A confidence interval is a range of values, derived from sample statistics, that is likely to contain the true population parameter. It is expressed with an upper and lower limit, indicating the degree of uncertainty around the estimate. For example, a 95% confidence interval suggests that if we were to take many samples, approximately 95% of the intervals calculated would contain the true mean.
추천 영상:
06:33
Introduction to Confidence Intervals

Sample Mean (x̄)

The sample mean, denoted as x̄, is the average of a set of observations from a sample. It serves as a point estimate of the population mean. In the context of the Old Faithful geyser data, the sample mean of 88.75 minutes represents the average time between eruptions based on the sampled data.
추천 영상:
05:11
Sampling Distribution of Sample Proportion

Sample Size (n)

The sample size, represented by n, is the number of observations in a sample. It is crucial for determining the reliability of statistical estimates; larger sample sizes generally lead to more accurate estimates of population parameters. In this case, n=36 indicates that the sample consists of 36 eruption times, which contributes to the calculation of the confidence interval.
추천 영상:
05:11
Sampling Distribution of Sample Proportion