

Ch. 8 - Hypothesis Testing
Triola - Elementary Statistics 14th Edition
Triola14th EditionElementary StatisticsISBN: 9780137366446당신이 사용하는 게 아니라요?교과서 변경
8장, 문제 32a

Hypothesis Test with Known σ


a. How do the results from Example 1 in this section change if σ is known to be 1.99240984 g? Does the knowledge of σ have much of an effect on the results of this hypothesis test?

검증된 단계별 안내
1
Step 1: Begin by identifying the null hypothesis (H₀) and the alternative hypothesis (Hₐ). The null hypothesis typically states that there is no effect or no difference, while the alternative hypothesis represents the claim being tested.
Step 2: Since σ (the population standard deviation) is known, use the z-test formula for hypothesis testing. The formula is: z=(-μ)σ/n, where x̄ is the sample mean, μ is the population mean under the null hypothesis, σ is the population standard deviation, and n is the sample size.
Step 3: Calculate the z-score using the given values for x̄, μ, σ, and n. Plug these values into the formula to compute the test statistic.
Step 4: Determine the critical z-value(s) based on the significance level (α) and whether the test is one-tailed or two-tailed. Compare the calculated z-score to the critical z-value(s) to decide whether to reject or fail to reject the null hypothesis.
Step 5: Reflect on the impact of knowing σ. When σ is known, the z-test is more precise because it uses the actual population standard deviation rather than an estimate. This can slightly affect the results, especially if the sample size is small or the estimated standard deviation differs significantly from the true σ.

비슷한 문제에 대한 검증된 영상 답변:

이 영상 해법은 위 문제에 도움이 된다고 튜터들이 추천한 것입니다.
영상 길이:
5m
도움이 되었나요?

주요 개념

질문에 올바르게 답하기 위해 반드시 이해해야 하는 핵심 개념들은 다음과 같습니다.

Hypothesis Testing

Hypothesis testing is a statistical method used to make decisions about a population based on sample data. It involves formulating a null hypothesis (H0) and an alternative hypothesis (H1), then using sample data to determine whether to reject H0. The outcome is assessed using a significance level, which indicates the probability of making a Type I error.
추천 영상:
가이드 코스
06:21
Step 1: Write Hypotheses

Standard Deviation (σ)

Standard deviation (σ) is a measure of the amount of variation or dispersion in a set of values. In hypothesis testing, knowing the population standard deviation allows for more accurate calculations of the test statistic and confidence intervals. When σ is known, it simplifies the process of determining the critical values and p-values in hypothesis tests.
추천 영상:
가이드 코스
08:45
Calculating Standard Deviation

Effect of Known σ on Hypothesis Testing

When the population standard deviation (σ) is known, it can significantly affect the results of a hypothesis test. Specifically, it allows the use of the Z-test, which is more powerful and provides more precise results compared to the t-test used when σ is unknown. This knowledge can lead to narrower confidence intervals and more reliable conclusions about the population parameter being tested.
추천 영상:
가이드 코스
07:23
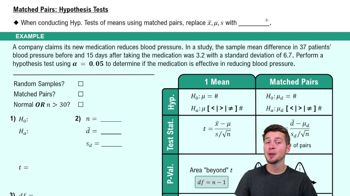
Matched Pairs: Hypothesis Tests
관련 실천
교과서 질문

Large Sample and a Small Difference It has been said that with really large samples, even very small differences between the sample mean and the claimed population mean can appear to be significant, but in reality they are not significant. Test this statement using the claim that the mean IQ score of adults is 100, given the following sample data: n = 1,000,000, x_bar = 100.05, s = 15 . Based on this sample, is the difference between x_bar = 100.05 and the claimed mean of 100 statistically significant? Does that difference have practical significance?

214
views
교과서 질문

Large Data Sets from Appendix B

In Exercises 25–28, use the data set from Appendix B to test the given claim. Use the P-value method unless your instructor specifies otherwise.


Los Angeles Commute Time Use the 1000 Los Angeles Commute times listed in Data Set 31 “Commute Times” to test the claim that the mean Los Angeles commute time is less than 35 minutes. Use a 0.01 significance level. Compare the sample mean to the claimed mean of 35 minutes. Is the difference between those two values statistically significant? Does the difference between those two values appear to have practical significance?

127
views
교과서 질문

Testing Hypotheses

In Exercises 13–24, assume that a simple random sample has been selected and test the given claim. Unless specified by your instructor, use either the P-value method or the critical value method for testing hypotheses. Identify the null and alternative hypotheses, test statistic, P-value (or range of P-values), or critical value(s), and state the final conclusion that addresses the original claim.


Got a Minute? Students of the author estimated the length of one minute without reference to a watch or clock, and the times (seconds) are listed below. Use a 0.05 significance level to test the claim that these times are from a population with a mean equal to 60 seconds. Does it appear that students are reasonably good at estimating one minute?


69 81 39 65 42 21 60 63 66 48 64 70 96 91 95

89
views