

Ch. 8 - Hypothesis Testing
Triola - Elementary Statistics 14th Edition
Triola14th EditionElementary StatisticsISBN: 9780137366446당신이 사용하는 게 아니라요?교과서 변경
8장, 문제 8.CR.6

Lightning Deaths The graph in Cumulative Review Exercise 5 was created by using data consisting of 242 male deaths from lightning strikes and 64 female deaths from lightning strikes. Assume that these data are randomly selected lightning deaths and proceed to test the claim that the proportion of male deaths is greater than . Use a 0.01 significance level. Any explanation for the result?

검증된 단계별 안내
1
State the null hypothesis (H₀) and the alternative hypothesis (H₁). The null hypothesis is H₀: p₁ ≤ p₂ (the proportion of male deaths is less than or equal to the proportion of female deaths). The alternative hypothesis is H₁: p₁ > p₂ (the proportion of male deaths is greater than the proportion of female deaths).
Calculate the sample proportions for male and female deaths. Let p₁ = x₁/n₁, where x₁ is the number of male deaths (242) and n₁ is the total number of deaths (242 + 64). Similarly, calculate p₂ = x₂/n₂, where x₂ is the number of female deaths (64) and n₂ is the total number of deaths.
Determine the pooled proportion (p̂) under the null hypothesis. The formula for the pooled proportion is: = (x₁ + x₂) / (n₁ + n₂), where x₁ and x₂ are the counts of male and female deaths, and n₁ and n₂ are the total sample sizes.
Compute the test statistic using the formula for a two-proportion z-test: z = (p₁ - p₂) / sqrt(p̂(1 - p̂)(1/n₁ + 1/n₂)). Substitute the values of p₁, p₂, p̂, n₁, and n₂ into the formula.
Compare the calculated z-value to the critical z-value for a one-tailed test at the 0.01 significance level. If the calculated z-value is greater than the critical z-value, reject the null hypothesis. Otherwise, fail to reject the null hypothesis. Interpret the result in the context of the problem.

비슷한 문제에 대한 검증된 영상 답변:

이 영상 해법은 위 문제에 도움이 된다고 튜터들이 추천한 것입니다.
영상 길이:
4m
도움이 되었나요?

주요 개념

질문에 올바르게 답하기 위해 반드시 이해해야 하는 핵심 개념들은 다음과 같습니다.

Hypothesis Testing

Hypothesis testing is a statistical method used to make decisions about a population based on sample data. It involves formulating a null hypothesis (H0) and an alternative hypothesis (H1). In this case, the null hypothesis would state that the proportion of male deaths is equal to or less than that of female deaths, while the alternative hypothesis would claim that the proportion of male deaths is greater.
추천 영상:
가이드 코스
06:21
Step 1: Write Hypotheses

Significance Level

The significance level, often denoted as alpha (α), is the threshold for determining whether to reject the null hypothesis. A significance level of 0.01 indicates that there is a 1% risk of concluding that a difference exists when there is none. This means that if the p-value obtained from the test is less than 0.01, we would reject the null hypothesis in favor of the alternative.
추천 영상:
가이드 코스
04:46
Step 4: State Conclusion Example 4

Proportion

A proportion is a statistical measure that represents the part of a whole. In this context, it refers to the ratio of male deaths to the total number of deaths from lightning strikes. Understanding proportions is crucial for comparing the likelihood of events occurring in different groups, such as male versus female deaths in this scenario.
추천 영상:
가이드 코스
09:27
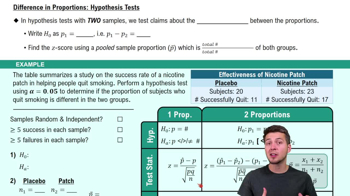
Difference in Proportions: Hypothesis Tests