


Ch. 8 - Hypothesis Testing
Triola - Elementary Statistics 14th Edition
Triola14th EditionElementary StatisticsISBN: 9780137366446당신이 사용하는 게 아니라요?교과서 변경
8장, 문제 9

Technology
In Exercises 9–12, test the given claim by using the display provided from technology. Use a 0.05 significance level. Identify the null and alternative hypotheses, test statistic, P-value (or range of P-values), or critical value(s), and state the final conclusion that addresses the original claim.


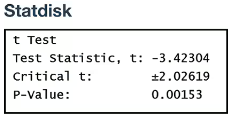
Peanut Butter Cups Data Set 38 “Candies” includes weights of Reese’s peanut butter cups. The accompanying Statdisk display results from using all 38 weights to test the claim that the sample is from a population with a mean equal to 8.953 g.


img

검증된 단계별 안내
1
Step 1: Identify the null and alternative hypotheses. The null hypothesis (H₀) states that the population mean is equal to 8.953 g (H₀: μ = 8.953). The alternative hypothesis (H₁) states that the population mean is not equal to 8.953 g (H₁: μ ≠ 8.953). This is a two-tailed test.
Step 2: Determine the test statistic. From the Statdisk display, the test statistic is t = -3.42304. This value measures how far the sample mean deviates from the hypothesized population mean in terms of standard errors.
Step 3: Identify the critical t-value. The critical t-value for a two-tailed test at a significance level of 0.05 is ±2.02619, as shown in the Statdisk display. This value defines the rejection regions for the null hypothesis.
Step 4: Compare the test statistic to the critical t-value. Since the test statistic t = -3.42304 falls outside the range defined by the critical t-values (±2.02619), it lies in the rejection region.
Step 5: Evaluate the P-value. The P-value is 0.00153, which is less than the significance level of 0.05. This indicates strong evidence against the null hypothesis. Based on the test statistic and P-value, the null hypothesis is rejected, and the conclusion is that the sample is not from a population with a mean equal to 8.953 g.

비슷한 문제에 대한 검증된 영상 답변:

이 영상 해법은 위 문제에 도움이 된다고 튜터들이 추천한 것입니다.
영상 길이:
5m
도움이 되었나요?

주요 개념

질문에 올바르게 답하기 위해 반드시 이해해야 하는 핵심 개념들은 다음과 같습니다.

Null and Alternative Hypotheses

In hypothesis testing, the null hypothesis (H0) represents a statement of no effect or no difference, while the alternative hypothesis (H1) suggests that there is an effect or a difference. For this question, the null hypothesis would state that the mean weight of the peanut butter cups is equal to 8.953 g, while the alternative hypothesis would claim that it is not equal to this value.
추천 영상:
가이드 코스
06:21
Step 1: Write Hypotheses

Test Statistic

The test statistic is a standardized value that is calculated from sample data during a hypothesis test. It measures how far the sample mean is from the null hypothesis mean, in terms of standard errors. In this case, the test statistic is -3.42304, indicating that the sample mean is significantly lower than the hypothesized mean of 8.953 g.
추천 영상:
가이드 코스
06:34
Step 2: Calculate Test Statistic

P-Value

The P-value is the probability of obtaining a test statistic at least as extreme as the one observed, assuming the null hypothesis is true. A low P-value (typically less than the significance level, such as 0.05) indicates strong evidence against the null hypothesis. Here, the P-value of 0.00153 suggests that there is strong evidence to reject the null hypothesis, supporting the claim that the mean weight is not equal to 8.953 g.
추천 영상:
가이드 코스
06:50
Step 3: Get P-Value
관련 실천
교과서 질문

Testing Hypotheses

In Exercises 13–24, assume that a simple random sample has been selected and test the given claim. Unless specified by your instructor, use either the P-value method or the critical value method for testing hypotheses. Identify the null and alternative hypotheses, test statistic, P-value (or range of P-values), or critical value(s), and state the final conclusion that addresses the original claim.


Diastolic Blood Pressure Diastolic blood pressure levels of 60 mm Hg or lower are considered to be too low. For the 300 diastolic blood pressure levels listed in Data Set 1 “Body Data” from Appendix B, the mean is 70.75333 mm Hg and the standard deviation is 11.61618 mm Hg. Use a 0.01 significance level to test the claim that the sample is from a population with a mean greater than 60 mm Hg.

118
views
교과서 질문

RESAMPLING

c. When testing a claim about a proportion or mean or standard deviation, what is an important advantage of using a resampling method instead of the parametric method described in the preceding sections of this chapter?

193
views
교과서 질문

Testing Hypotheses

In Exercises 13–24, assume that a simple random sample has been selected and test the given claim. Unless specified by your instructor, use either the P-value method or the critical value method for testing hypotheses. Identify the null and alternative hypotheses, test statistic, P-value (or range of P-values), or critical value(s), and state the final conclusion that addresses the original claim.


Systolic Blood Pressure Systolic blood pressure levels above 120 mm Hg are considered to be high. For the 300 systolic blood pressure levels listed in Data Set 1 “Body Data” from Appendix B, the mean is 122.96000 mm Hg and the standard deviation is 15.85169 mm Hg. Use a 0.01 significance level to test the claim that the sample is from a population with a mean greater than 120 mm Hg.

115
views
교과서 질문

Using Confidence Intervals to Test Hypotheses When analyzing the last digits of telephone numbers in Port Jefferson, it is found that among 1000 randomly selected digits, 119 are zeros. If the digits are randomly selected, the proportion of zeros should be 0.1.


d. Compare the results from the critical value method, the P-value method, and the confidence interval method. Do they all lead to the same conclusion?

148
views
교과서 질문

Lightning Deaths Listed below are the numbers of deaths from lightning strikes in the United States each year for a sequence of recent and consecutive years. Find the values of the indicated statistics.

46 51 44 51 43 32 38 48 45 27 34 29 26 28 23 26 28 40 16 20

e. Range

113
views
교과서 질문

Technology

In Exercises 9–12, test the given claim by using the display provided from technology. Use a 0.05 significance level. Identify the null and alternative hypotheses, test statistic, P-value (or range of P-values), or critical value(s), and state the final conclusion that addresses the original claim.


Tower of Terror Data Set 33 “Disney World Wait Times” includes wait times (minutes) for the Tower of Terror ride at 5:00 PM. Using the first 40 times to test the claim that the mean of all such wait times is more than 30 minutes, the accompanying Excel display is obtained.


126
views