
교과서 질문
Smoking Cessation Programs
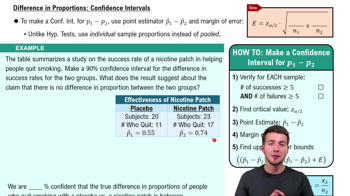
a. Construct the confidence interval that could be used to test the claim in Exercise 5. What feature of the confidence interval leads to the same conclusion from Exercise 5?
133
views

 검증된 단계별 안내
 08:09
08:09
 05:11
05:11 06:21
06:21Smoking Cessation Programs
a. Construct the confidence interval that could be used to test the claim in Exercise 5. What feature of the confidence interval leads to the same conclusion from Exercise 5?
Body Temperatures Listed below are body temperatures from six different subjects measured at two different times in a day (from Data Set 5 “Body Temperatures” in Appendix B).
b. Identify the null and alternative hypotheses for using the sample data to test the claim that the differences between 8 AM temperatures and 12 AM temperatures are from a population with a mean equal to 0°F
Identifying Hypotheses In a randomized clinical trial of adults with an acute sore throat, 288 were treated with the drug dexamethasone and 102 of them experienced complete resolution; 277 were treated with a placebo and 75 of them experienced complete resolution (based on data from “Effect of Oral Dexamethasone Without Immediate Antibiotics vs Placebo on Acute Sore Throat in Adults,” by Hayward et al., Journal of the American Medical Association). Identify the null and alternative hypotheses corresponding to the claim that patients treated with dexamethasone and patients given a placebo have the same rate of complete resolution.
Variation Find the value of the test statistic used for testing the claim that the two samples from Exercise 5 are from populations having the same variation.
In Exercises 1–10, based on the nature of the given data, do the following:
a. Pose a key question that is relevant to the given data.
b. Identify a procedure or tool from this chapter or the preceding chapters to address the key question from part (a).
c. Analyze the data and state a conclusion.
IQ Scores of Twins Listed below are IQ scores of twins listed in Data Set 12 “IQ and Brain Size” in Appendix B. The data are pairs of IQ scores from ten different families.
Smoking Cessation Programs Among 198 smokers who underwent a “sustained care” program, 51 were no longer smoking after six months. Among 199 smokers who underwent a “standard care” program, 30 were no longer smoking after six months (based on data from “Sustained Care Intervention and Postdischarge Smoking Cessation Among Hospitalized Adults,” by Rigotti et al., Journal of the American Medical Association, Vol. 312, No. 7). We want to use a 0.01 significance level to test the claim that the rate of success for smoking cessation is greater with the sustained care program. Test the claim using a hypothesis test.