Skip to main content
Trigonometry
나의 코스
배우기
시험 준비
AI 튜터
학습 가이드
교과서적 해결책
플래시카드
탐험해 보세요
앱을 사용해 보세요
나의 코스
배우기
시험 준비
AI 튜터
학습 가이드
교과서적 해결책
플래시카드
탐험해 보세요
앱을 사용해 보세요
뒤로
Graphing Parametric Equations definitions
카드를 뒤집기 위해 탭할 수 있습니다.
Parametric Equations
카드를 뒤집기 위해 탭할 수 있습니다.
👆
Parametric Equations
Expressions where two variables are written in terms of a third variable, typically used to describe motion or curves.
진행 상황 추적
컨트롤 버튼이 '내비게이션' 모드로 변경되었습니다.
1/15
관련 플래시카드
관련 실천
추천 영상
Graphing Parametric Equations quiz #1
Graphing Parametric Equations
10 용어
Graphing Parametric Equations
10. Parametric Equations
1 문제
주제
ErnestBlazevic
Eliminate the Parameter
10. Parametric Equations
1 문제
주제
AllySteele
10. Parametric Equations
1 주제
2 문제점
장
VideoThumbView.guidedCourse
04:47
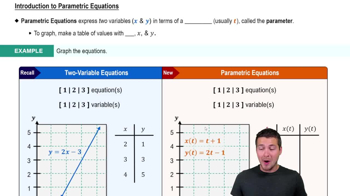
Introduction to Parametric Equations
836
views
1
comments
이 집합의 용어 (15)
하이드의 정의
Parametric Equations
Expressions where two variables are written in terms of a third variable, typically used to describe motion or curves.
Parameter
A third variable, often labeled t, that determines the values of other variables in a set of equations.
Plane Curve
A set of points in a plane traced by parametric equations, forming shapes like lines, parabolas, or more complex figures.
Orientation
The direction indicated on a graph, showing how the curve progresses as the parameter increases.
Table of Values
A chart listing the parameter and corresponding x and y values, used to organize points for graphing.
Coordinate Pair
A set of x and y values derived from the parameter, representing a point on the graph.
Arrow
A graphical symbol used to show the direction of increasing parameter values along a curve.
x(t)
An expression for the x-coordinate as a function of the parameter, used to generate graph points.
y(t)
An expression for the y-coordinate as a function of the parameter, used to generate graph points.
Axis
A reference line on a graph; in parametric graphs, the parameter does not have its own axis.
Line
A straight shape that can be represented by parametric equations, connecting plotted points.
Parabola
A curved shape that can be described by parametric equations, often appearing in more complex graphs.
Graph
A visual representation of points generated from parametric equations, showing their relationship in the plane.
Input
A value for the parameter used to calculate corresponding x and y values in parametric equations.
Output
The resulting x and y values obtained from substituting the parameter into the equations.
 뒤로뒤로
뒤로뒤로

 04:47
04:47