Ch. 2 - Graphs of the Trigonometric Functions; Inverse Trigonometric Functions
Blitzer - Trigonometry 3rd Edition
Blitzer3rd EditionTrigonometryISBN: 9780137316601당신이 사용하는 게 아니라요?교과서 변경
2장, 문제 3

Determine the amplitude of each function. Then graph the function and y = sin x in the same rectangular coordinate system for 0 ≤ x ≤ 2π. y = 1/3 sin x

검증된 단계별 안내
1
Identify the amplitude of the function y = \(\frac{1}{3}\) \(\sin\) x. The amplitude of a sine function y = A \(\sin\) x is the absolute value of the coefficient A in front of \(\sin\) x.
Write down the amplitude as |\(\frac{1}{3}\)|, which represents the maximum distance the sine wave reaches from the horizontal axis (y = 0).
To graph the function y = \(\frac{1}{3}\) \(\sin\) x, plot points for values of x between 0 and 2\(\pi\), calculating y by multiplying \(\sin\) x by \(\frac{1}{3}\) at each point.
On the same coordinate system, graph y = \(\sin\) x for 0 \(\leq\) x \(\leq\) 2\(\pi\), noting that its amplitude is 1, so it reaches higher and lower peaks compared to y = \(\frac{1}{3}\) \(\sin\) x.
Compare the two graphs to observe how the amplitude affects the height of the sine wave, with y = \(\frac{1}{3}\) \(\sin\) x having smaller peaks and troughs than y = \(\sin\) x.

비슷한 문제에 대한 검증된 영상 답변:

이 영상 해법은 위 문제에 도움이 된다고 튜터들이 추천한 것입니다.
영상 길이:
5m
도움이 되었나요?

주요 개념

질문에 올바르게 답하기 위해 반드시 이해해야 하는 핵심 개념들은 다음과 같습니다.

Amplitude of a Sine Function

The amplitude of a sine function is the absolute value of the coefficient in front of the sine term. It represents the maximum vertical distance from the midline (usually the x-axis) to the peak of the wave. For y = (1/3) sin x, the amplitude is |1/3| = 1/3.
추천 영상:
5:05
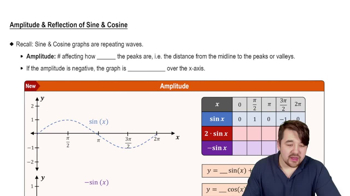
Amplitude and Reflection of Sine and Cosine

Graphing Sine Functions

Graphing a sine function involves plotting points based on its amplitude, period, phase shift, and vertical shift. The basic sine function y = sin x has an amplitude of 1 and period 2π. Modifying the amplitude scales the graph vertically, affecting the height of peaks and troughs.
추천 영상:
5:53
Graph of Sine and Cosine Function

Comparing Functions on the Same Coordinate System

Plotting multiple functions on the same axes allows visual comparison of their behaviors. Here, graphing y = (1/3) sin x alongside y = sin x over 0 ≤ x ≤ 2π shows how amplitude changes affect the wave's height while the period and shape remain consistent.
추천 영상:
6:02
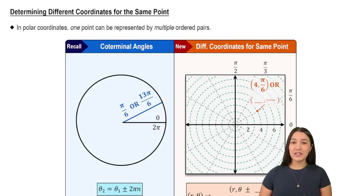
Determining Different Coordinates for the Same Point