Ch. 2 - Graphs of the Trigonometric Functions; Inverse Trigonometric Functions
Blitzer - Trigonometry 3rd Edition
Blitzer3rd EditionTrigonometryISBN: 9780137316601당신이 사용하는 게 아니라요?교과서 변경
2장, 문제 13

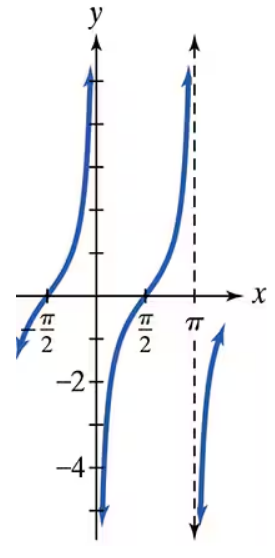
The graph of a cotangent function is given. Select the equation for each graph from the following options: y = cot(x + π/2), y = cot(x + π), y = −cot x, y= −cot(x − π/2).

검증된 단계별 안내
1
Identify the vertical asymptotes of the cotangent graph. From the graph, the vertical asymptotes are at \(x = -\frac{2\pi}{3}\) and \(x = \frac{\pi}{3}\).
Recall that the standard cotangent function \(y = \cot x\) has vertical asymptotes at \(x = k\pi\), where \(k\) is an integer. The period of \(\cot x\) is \(\pi\).
Compare the given asymptotes with the standard cotangent asymptotes. The asymptotes here are shifted compared to the standard \(x = 0\) and \(x = \pi\) asymptotes of \(y = \cot x\).
Calculate the horizontal shift by comparing the asymptotes. The shift appears to be \(-\frac{\pi}{3}\) from the standard positions, indicating a phase shift in the function.
Match the phase shift and reflection with the given options. Since the graph is shifted and the shape matches a negative cotangent function shifted by \(\frac{\pi}{2}\), the equation corresponds to \(y = -\cot(x - \frac{\pi}{2})\).

비슷한 문제에 대한 검증된 영상 답변:

이 영상 해법은 위 문제에 도움이 된다고 튜터들이 추천한 것입니다.
영상 길이:
4m
도움이 되었나요?

주요 개념

질문에 올바르게 답하기 위해 반드시 이해해야 하는 핵심 개념들은 다음과 같습니다.

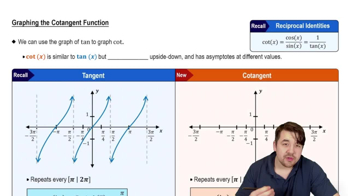
Cotangent Function and Its Graph

The cotangent function, cot(x), is the reciprocal of the tangent function and has vertical asymptotes where sin(x) = 0, i.e., at multiples of π. Its graph is periodic with period π, and it decreases from positive infinity to negative infinity between asymptotes. Understanding the shape and behavior of cot(x) is essential for identifying transformations.
추천 영상:
5:37
Introduction to Cotangent Graph

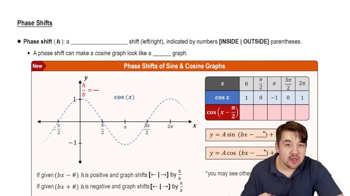
Phase Shifts in Trigonometric Functions

A phase shift in a trigonometric function like cot(x + c) shifts the graph horizontally by -c units. Positive inside the function shifts the graph to the left, and negative shifts it to the right. Recognizing how phase shifts affect the position of vertical asymptotes and zeros helps match the graph to its equation.
추천 영상:
6:31
Phase Shifts

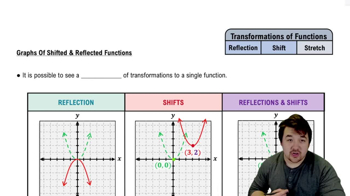
Reflection and Vertical Shifts of Cotangent

Multiplying cot(x) by -1 reflects the graph across the x-axis, reversing its increasing/decreasing behavior. This changes the sign of the function values but keeps the vertical asymptotes in the same place. Identifying reflections is key to distinguishing between equations like cot(x) and -cot(x).
추천 영상:
4:25
Graphs of Shifted and Reflected Functions