Ch. 2 - Graphs of the Trigonometric Functions; Inverse Trigonometric Functions
Blitzer - Trigonometry 3rd Edition
Blitzer3rd EditionTrigonometryISBN: 9780137316601당신이 사용하는 게 아니라요?교과서 변경
2장, 문제 15

In Exercises 14–15, use the method of adding y-coordinates to graph each function for 0 ≤ x ≤ 2π. y = sin x + cos 1/2 x

검증된 단계별 안내
1
Identify the two separate functions involved: \( y_1 = \sin x \) and \( y_2 = \cos \frac{1}{2} x \). We will graph each function individually over the interval \( 0 \leq x \leq 2\pi \).
Create a table of values for \( y_1 = \sin x \) by choosing key points in the interval \( 0, \frac{\pi}{2}, \pi, \frac{3\pi}{2}, 2\pi \) and calculating \( \sin x \) at these points.
Similarly, create a table of values for \( y_2 = \cos \frac{1}{2} x \) using the same \( x \)-values, but calculate \( \cos \left( \frac{1}{2} x \right) \) at each point.
Add the corresponding \( y \)-coordinates from the two tables to find the values of \( y = \sin x + \cos \frac{1}{2} x \) at each \( x \)-value. This means for each \( x \), compute \( y = y_1 + y_2 \).
Plot the points \( (x, y) \) obtained from the sums on the coordinate plane and connect them smoothly to graph the function \( y = \sin x + \cos \frac{1}{2} x \) over the interval \( 0 \leq x \leq 2\pi \).

비슷한 문제에 대한 검증된 영상 답변:

이 영상 해법은 위 문제에 도움이 된다고 튜터들이 추천한 것입니다.
영상 길이:
3m
도움이 되었나요?

주요 개념

질문에 올바르게 답하기 위해 반드시 이해해야 하는 핵심 개념들은 다음과 같습니다.

Graphing Trigonometric Functions

Graphing trigonometric functions involves plotting points based on their values at various x-coordinates, typically over one or more periods. Understanding the shape and period of sine and cosine functions helps in accurately sketching their graphs.
추천 영상:
6:04
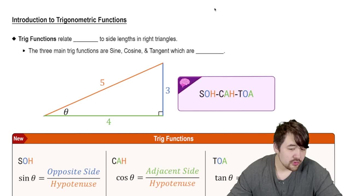
Introduction to Trigonometric Functions

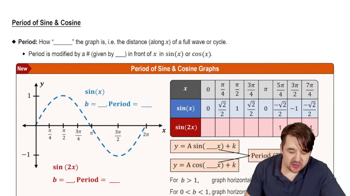
Period and Frequency of Trigonometric Functions

The period of a trigonometric function is the length of one complete cycle. For y = cos(1/2 x), the period is 4π because the frequency is halved. Recognizing how coefficients inside the function affect the period is essential for correct graphing.
추천 영상:
5:33
Period of Sine and Cosine Functions

Adding Functions by Summing y-Coordinates

When adding two functions, the resulting graph is found by adding their y-values at each x-coordinate. This method requires calculating y-values of each function separately and then summing them to get the combined function's graph.
추천 영상:
5:20
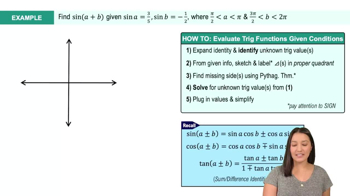
Example 7