Ch. 4 - Graphs of the Circular Functions
Lial - Trigonometry 12th Edition
Lial12th EditionTrigonometryISBN: 9780136552161당신이 사용하는 게 아니라요?교과서 변경
5장, 문제 1

Fill in the blank(s) to correctly complete each sentence.
The graph of y = sin (x + π/4) is obtained by shifting the graph of y = sin x ______ unit(s) to the ________ (right/left).

검증된 단계별 안내
1
Recall that the function y = sin(x + c) represents a horizontal shift of the basic sine function y = sin x, where c is a constant.
If the function is y = sin(x + \(\frac{\pi}{4}\)), the graph is shifted horizontally by \(\frac{\pi}{4}\) units.
Since the argument inside the sine function is (x + \(\frac{\pi}{4}\)), this corresponds to a shift to the left by \(\frac{\pi}{4}\) units (because adding inside the function shifts the graph left).
Therefore, the graph of y = sin(x + \(\frac{\pi}{4}\)) is obtained by shifting the graph of y = sin x \(\frac{\pi}{4}\) unit(s) to the left.
This is a standard property of function transformations: y = sin(x + c) shifts the graph left by c units, and y = sin(x - c) shifts it right by c units.

비슷한 문제에 대한 검증된 영상 답변:

이 영상 해법은 위 문제에 도움이 된다고 튜터들이 추천한 것입니다.
도움이 되었나요?

주요 개념

질문에 올바르게 답하기 위해 반드시 이해해야 하는 핵심 개념들은 다음과 같습니다.

Phase Shift in Trigonometric Functions

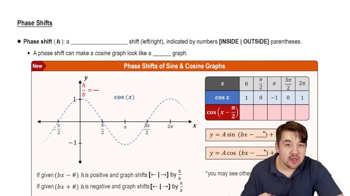
Phase shift refers to the horizontal translation of a trigonometric graph caused by adding or subtracting a constant inside the function's argument. For y = sin(x + π/4), the graph shifts horizontally by π/4 units. The sign inside the function determines the direction of the shift.
추천 영상:
6:31
Phase Shifts

Graph of the Sine Function

The sine function y = sin x is periodic with period 2π and oscillates between -1 and 1. Understanding its basic shape and key points helps in visualizing transformations like shifts, stretches, and reflections applied to the graph.
추천 영상:
5:53
Graph of Sine and Cosine Function

Effect of Adding a Positive Constant Inside the Function Argument

Adding a positive constant inside the argument of sine, as in sin(x + c), shifts the graph to the left by c units. This is because the input values that produce the same output occur earlier on the x-axis, effectively moving the graph leftward.
추천 영상:
3:30
Example 3