Skip to main content
Macroeconomics
My Course
Learn
Exam Prep
AI Tutor
Study Guides
Flashcards
Explore
Try the app
My Course
Learn
Exam Prep
AI Tutor
Study Guides
Flashcards
Explore
Try the app
Back
Supply and Demand: Quantitative Analysis definitions
You can tap to flip the card.
Equilibrium
You can tap to flip the card.
👆
Equilibrium
Occurs where quantity supplied equals quantity demanded, represented by the intersection of supply and demand curves on a graph.
Track progress
Control buttons has been changed to "navigation" mode.
1/15
Related flashcards
Related practice
Recommended videos
Supply and Demand: Quantitative Analysis quiz
Supply and Demand: Quantitative Analysis
15 Terms
Supply and Demand Together: Both Shift
3. Supply and Demand
10 problems
Topic
3. Supply and Demand
11 topics
15 problems
Chapter
Guided course
05:11
Finding Equilibrium Using Algebra
2806
views
11
rank
Guided course
03:56
Isolating Variables in the Demand Equation
2885
views
24
rank
Guided course
07:22
Finding Equilibrium with Equations and a Graph
2627
views
33
rank
Terms in this set (15)
Hide definitions
Equilibrium
Occurs where quantity supplied equals quantity demanded, represented by the intersection of supply and demand curves on a graph.
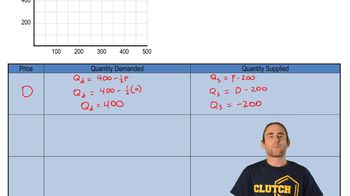
Demand Curve
A graphical representation showing the relationship between price and quantity demanded, typically sloping downward.
Supply Curve
A graphical representation showing the relationship between price and quantity supplied, typically sloping upward.
Quantity Demanded
The amount consumers are willing to buy at a specific price, found by plugging price values into the demand equation.
Quantity Supplied
The amount producers are willing to sell at a specific price, found by plugging price values into the supply equation.
Equilibrium Price
The price at which the quantity supplied matches the quantity demanded, often labeled as P star.
Equilibrium Quantity
The quantity at which the supply and demand curves intersect, often labeled as Q star.
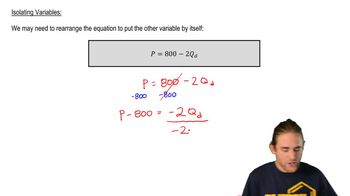
Algebraic Manipulation
The process of rearranging equations to isolate variables, such as solving for price or quantity.
Graphical Representation
A visual method for analyzing supply and demand by plotting equations and identifying intersections.
Isolated Variable
A variable that appears alone on one side of an equation, making it easier to solve for other values.
Intersection Point
The spot on a graph where the supply and demand curves cross, indicating market equilibrium.
Coefficient
A numerical factor multiplying a variable in an equation, such as the -2 in -2Q.
Linear Equation
An equation representing a straight line, commonly used for supply and demand relationships.
Reciprocal
A mathematical value used to isolate a variable, such as multiplying by 2/3 to solve for price.
Axis
The reference lines on a graph, typically representing price and quantity in supply and demand analysis.
 BackBack
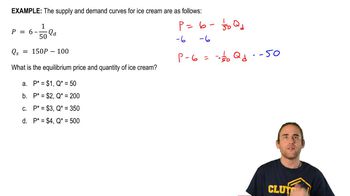
 05:11
05:11