Which conclusion would make the most sense after looking at a graph showing a positive correlation between two variables?
The most reasonable conclusion is that as one variable increases, the other variable also increases, indicating a positive correlation. However, this does not necessarily mean that one variable causes the other; further analysis is needed to determine causation.
What are common distortions that occur in graphs when interpreting relationships between variables?
A common distortion is omitted variable bias, where an important variable is left out of the analysis, potentially leading to misleading conclusions. Another distortion is reverse causality, where the direction of cause and effect is incorrectly interpreted.
What is the main difference between correlation and causation?
Correlation is when two variables move together in a predictable way, while causation means one variable directly causes a change in the other.
How is a negative correlation represented on a graph?
A negative correlation is shown when one variable increases as the other decreases, resulting in a downward-sloping line or curve.
What does a direct relationship between two variables mean?
A direct relationship means both variables increase or decrease together, indicating a positive correlation.
Why might a graph showing education and wages be misleading without considering experience?
It could be misleading because experience is an omitted variable that also affects wages, so the graph does not show the full picture.
What is reverse causality in the context of interpreting graphs?
Reverse causality occurs when the direction of cause and effect is confused, such as assuming police officers cause crime instead of crime leading to more police officers.
How can omitted variable bias affect the interpretation of a graph?
Omitted variable bias can lead to incorrect conclusions because an important factor influencing the relationship is left out of the analysis.
What is an example of a positive correlation given in the lesson?
An example is the relationship between outside temperature and ice cream sales, where both increase together.
What is an example of a negative correlation discussed in the video?
The example given is the relationship between class absences and grades, where more absences are associated with lower grades.
 Back
Back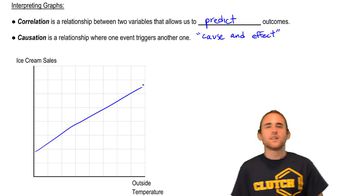
 03:27
03:27