Back
BackProduction Possibilities Frontier (PPF) - Introduction and Productive Efficiency quiz #2
You can tap to flip the card.
Control buttons has been changed to "navigation" mode.
1/22- Production Possibilities Frontier (PPF) - Introduction and Productive Efficiency quiz #1Production Possibilities Frontier (PPF) - Introduction and Productive Efficiency38 Terms
- Production Possibilities Frontier (PPF) - Introduction and Productive Efficiency definitionsProduction Possibilities Frontier (PPF) - Introduction and Productive Efficiency14 Terms
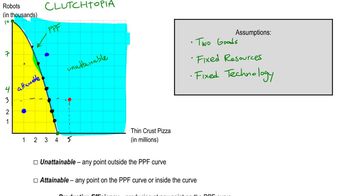
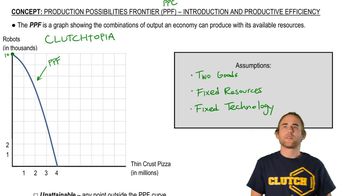
Production Possibilities Frontier (PPF) - Introduction and Productive Efficiency
2. Introductory Economic Models
10 problems
Topic
PPF - Increasing Marginal Opportunity Costs and Allocative Efficiency
2. Introductory Economic Models
10 problems
Topic
2. Introductory Economic Models
6 topics 15 problems
Chapter
 06:23
06:23