Which of the black lines represents the tangent line that shows the slope of the curve at the point indicated by the dot?
The black line that is tangent to the curve at the point indicated by the dot—touching the curve at only that point and not intersecting it elsewhere—shows the slope of the data at that point. The slope of this tangent line equals the slope of the curve at the dot.
 Back
Back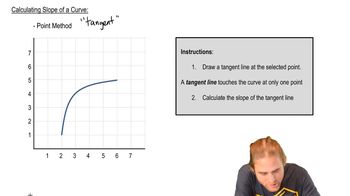
 03:40
03:40