 Back
Microeconomics: Consumer and Demand Concepts
 08:41

Terms in this set (25)
measures the satisfaction or benefit a consumer receives from consuming goods and services.
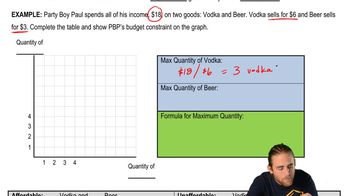
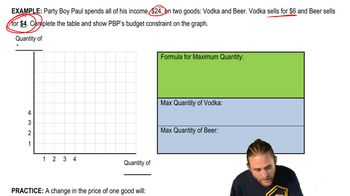
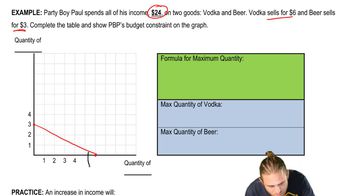
The budget constraint shows all combinations of goods that exactly exhaust income: \(p_1x_1 + p_2x_2 = I\).
The budget set includes all affordable allocations, on or inside the budget line, defined by \(p_1x_1 + p_2x_2 \leq I\).
If x1 is horizontal and x2 vertical, slope = \(-\frac{p_1}{p_2}\), representing opportunity cost of one more unit of good 1 in units of good 2.
An increase in income shifts the budget line outward in parallel; a decrease shifts it inward. The slope remains unchanged because prices are constant.
A price change of one good rotates the budget line by changing one intercept while the other stays fixed.
Opportunity cost is the value of the next-best alternative given up when making a choice; it is not always monetary.
A sunk cost is a cost already incurred and unrecoverable; it should not affect current decisions.
Marginal benefit is the additional benefit from consuming one more unit, usually diminishing as quantity increases.
Consumers optimize by equalizing marginal benefit per dollar spent: \(\frac{MB_1}{p_1} = \frac{MB_2}{p_2}\), staying within budget.
Quantity demanded is the amount consumers buy at a specific price; demand is the entire price-quantity relationship.
A change in a good's own price causes movement along the demand curve (change in quantity demanded), not a shift in demand.
Non-price factors like income, tastes, expectations, number of buyers, and prices of related goods shift the demand curve.
For normal goods, demand increases when income rises and decreases when income falls.
For inferior goods, demand decreases when income rises and increases when income falls.
Substitutes are goods used in place of each other; if the price of one rises, demand for the other increases.
Complements are goods consumed together; if the price of one rises, demand for the other decreases.
The substitution effect occurs when a price change makes a good relatively cheaper or more expensive, changing consumption toward the cheaper good.
The income effect occurs when a price change alters purchasing power, affecting the quantity demanded as if real income changed.
Consumer surplus is the difference between willingness to pay and price paid; graphically, it is the area below demand and above price.
PED measures responsiveness of quantity demanded to price changes: \(PED = \frac{\% \Delta QD}{\% \Delta P}\).
If |PED| = 0, demand is perfectly inelastic; if 0 < |PED| < 1, inelastic; if |PED| = 1, unit elastic; if |PED| > 1, elastic; if infinite, perfectly elastic.
The midpoint method calculates percentage changes using averages to avoid direction bias in elasticity: \(\frac{new - old}{(new + old)/2} \times 100\).
Measures how quantity demanded of one good responds to price change of another: positive means substitutes, negative means complements, near zero means unrelated.
Measures how quantity demanded responds to income changes: positive means normal good, negative means inferior good.