Skip to main content
Precalculus
My Course
Learn
Exam Prep
AI Tutor
Study Guides
Flashcards
Explore
Try the app
My Course
Learn
Exam Prep
AI Tutor
Study Guides
Flashcards
Explore
Try the app
Back
Graphing Inequalities in Precalculus
You can tap to flip the card.
What is the first step in graphing an inequality?
You can tap to flip the card.
👆
What is the first step in graphing an inequality?
Replace the inequality symbol with an equal sign and graph the resulting equation.
Track progress
Control buttons has been changed to "navigation" mode.
1/20
Recommended videos
Guided course
05:18
Interval Notation
2390
views
69
rank
Guided course
03:42
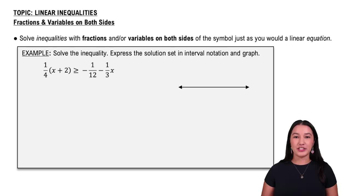
Linear Inequalities with Fractions & Variables on Both Sides
1211
views
37
rank
06:07
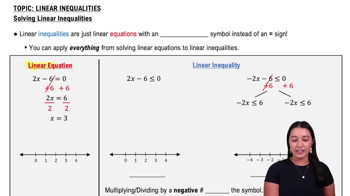
Linear Inequalities
1401
views
37
rank
1
comments
Terms in this set (20)
Hide definitions
What is the first step in graphing an inequality?
Replace the inequality symbol with an equal sign and graph the resulting equation.
When do you use a dotted line in graphing inequalities?
Use a dotted line if the inequality is < or >, indicating the boundary is not included.
When do you use a solid line in graphing inequalities?
Use a solid line if the inequality is ≤ or ≥, indicating the boundary is included.
How do you determine which side of the boundary line to shade?
Choose a test point not on the boundary, plug it into the inequality, and shade the region where the inequality is true.
What is the solution to a system of inequalities?
The intersection of the shaded regions that satisfy all inequalities in the system.
How is the inequality \(y \leq -2\) graphed?
Graph the line y = -2 as a solid line and shade the region below it.
How do you graph a circle inequality like \((x - h)^2 + (y - k)^2 \leq r^2\)?
Graph the circle with center (h, k) and radius r using a solid line and shade inside the circle.
What does a dashed parabola boundary indicate in an inequality?
It indicates the inequality is strict (< or >), so the parabola itself is not included.
How do you graph the inequality \(y < x + 1\)?
Graph the line y = x + 1 with a dashed line and shade below the line.
What does it mean if two inequalities have no intersection in their shaded regions?
The system has no solution; the solution set is the empty set.
How do you graph vertical line inequalities like \(x \geq a\)?
Graph the vertical line x = a as solid if ≥ or ≤, dashed if > or <, and shade the appropriate side.
What is the test point commonly used when shading inequalities?
The point (0, 0) is often used unless it lies on the boundary line.
How do you graph the inequality \(x - y > -2\)?
Graph the line x - y = -2 with a dashed line and shade the region where x - y > -2.
How do you graph the inequality \(x^2 + y^2 > 36\)?
Graph the circle x^2 + y^2 = 36 with a dashed line and shade outside the circle.
How do you graph the inequality \(y \leq x^2 + 3\)?
Graph the parabola y = x^2 + 3 with a solid line and shade below it.
What is the solution set for the system \(x + 2y \geq 2\) and \(x - y \leq 0\)?
The intersection of the regions satisfying both inequalities, found by graphing each and shading their overlap.
How do you graph the system \(-x + 5y < 15\) and \(x \geq 2\)?
Graph each inequality with appropriate boundary lines and shade the intersection of their solution regions.
What does shading below a line represent in an inequality?
It represents all points where the y-values satisfy the inequality relative to the line.
What is the significance of the boundary line in graphing inequalities?
It separates the coordinate plane into regions where the inequality is true or false.
Why is the test point (0,0) often chosen when graphing inequalities?
Because it is easy to substitute and usually not on the boundary line.
 BackBack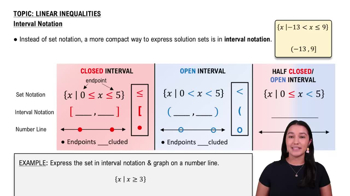
 05:18
05:18