 Back
BackBiostatistics and Clinical Trial Interpretation: Key Concepts and Applications
Study Guide - Smart Notes
 Tailored notes based on your materials, expanded with key definitions, examples, and context.
Measures of Central Tendency and Dispersion
Mean, Median, and Mode
Measures of central tendency are used to describe the center of a dataset. The mean is the arithmetic average, the median is the middle value, and the mode is the most frequently occurring value.
Mean:
Median: The value separating the higher half from the lower half of a data sample.
Mode: The value that appears most frequently in a dataset.
Example: For ages 20, 25, 30, 35, 40, the mean is 30, the median is 30, and there is no mode.
Standard Deviation
Standard deviation (SD) measures the spread of data points from the mean. A low SD indicates data points are close to the mean, while a high SD indicates greater dispersion.
Formula:
Example: Dataset A: 20, 25, 30, 35, 40 (SD ≈ 7.91); Dataset B: 10, 20, 30, 40, 50 (SD ≈ 15.81).
Sample Statistics vs Population Parameters
Definitions and Applications
Sample statistics are calculated from a subset of the population and used to estimate population parameters, which describe the entire population.
Sample Mean: Average age from a sample of 100 individuals.
Population Mean: Average age of all individuals in a city.
Confidence Intervals and Statistical Significance
Confidence Interval of the Mean
A confidence interval (CI) provides a range within which the true population parameter is likely to lie, with a specified level of confidence (e.g., 95%).
Formula:
Example: If the mean sleep time is 7 hours with a 95% CI of ±0.5 hours, the true mean is likely between 6.5 and 7.5 hours.
P-value and Statistical Significance
The p-value measures the strength of evidence against the null hypothesis. A result is statistically significant if the p-value is less than the chosen alpha level (commonly 0.05).
Example: p-value of 0.01 indicates strong evidence against the null hypothesis.
Risk, Odds, and Ratios
Risk and Risk Ratio
Risk is the probability of an event occurring. The risk ratio (RR) compares the risk between two groups.
Formula:
Example: If risk in smokers is 20% and in non-smokers is 10%, RR = 2.
Odds and Odds Ratio
Odds represent the likelihood of an event occurring versus not occurring. The odds ratio (OR) compares odds between two groups.
Formula:
Diagnostic Test Evaluation
Sensitivity, Specificity, and Predictive Values
These metrics assess the performance of diagnostic tests:
Sensitivity: Ability to correctly identify those with disease (true positive rate).
Specificity: Ability to correctly identify those without disease (true negative rate).
Positive Predictive Value (PPV): Probability that a positive test result indicates disease.
Negative Predictive Value (NPV): Probability that a negative test result indicates absence of disease.
Hazard Ratio and Survival Analysis
Hazard Ratio (HR)
The hazard ratio compares the rate of occurrence of an event between two groups over time, often used in survival analysis.
HR = 1: No difference between groups.
HR < 1: Lower risk in treatment group.
HR > 1: Higher risk in treatment group.
Biostatistics Assignment: Calculations and Interpretation
Vaccine Efficacy and Risk Reduction
Using the provided table, calculate:
Group | Influenza Yes | Influenza No | Total |
|---|---|---|---|
Vaccine Yes | 20 (8.3%) | 220 (91.7%) | 240 |
Placebo No | 80 (36.4%) | 140 (63.6%) | 220 |
Total | 100 (21.7%) | 360 (78.3%) | 460 |
Absolute Risk Reduction (ARR):
Number Needed to Treat (NNT):
Relative Risk Reduction (RRR):
Risk Ratio (RR):
Odds Ratio (OR):
Diagnostic Test Performance: PSA Screening
PSA Test | Prostate Cancer Yes | Prostate Cancer No | Total |
|---|---|---|---|
PSA +ve | 21 (true positive) | 6 (false positive) | 27 |
PSA -ve | 79 (false negative) | 94 (true negative) | 173 |
Total | 100 | 100 | 200 |
Sensitivity: (21%)
Specificity: (94%)
PPV: (78%)
NPV: (54%)
Relative Risk: CHD and BMI
BMI | Death | Alive | Total |
|---|---|---|---|
High | 63 | 498 | 561 |
Low | 21 | 558 | 579 |
Total | 84 | 1056 | 1140 |
Relative Risk (RR):
Interpretation: High BMI increases risk of CHD death by 3 times compared to low BMI.
Clinical Trial Interpretation: Ranolazine vs Placebo
Primary and Secondary Endpoints
Clinical trials often report hazard ratios, confidence intervals, and p-values to assess treatment efficacy. The table below summarizes efficacy outcomes for Ranolazine vs Placebo:
Outcome | Ranolazine | Placebo | Hazard Ratio | 95% CI | P Value |
|---|---|---|---|---|---|
Primary end point | 696 (21.8%) | 735 (22.4%) | 0.92 | 0.83-1.02 | .11 |
Recurrent ischemia | 217 (6.6%) | 246 (7.5%) | 0.87 | 0.72-1.04 | .13 |
Cardiovascular death | 107 (3.3%) | 125 (3.8%) | 0.89 | 0.68-1.16 | .38 |
MI | 236 (7.2%) | 241 (7.3%) | 0.98 | 0.81-1.18 | .83 |
Failure of therapy | 117 (3.6%) | 135 (4.1%) | 0.87 | 0.67-1.13 | .29 |
Interpretation: The hazard ratio for the primary endpoint is 0.92 (95% CI: 0.83–1.02, p=0.11), indicating no statistically significant difference between Ranolazine and Placebo. For recurrent ischemia, HR is 0.87 (95% CI: 0.72–1.04, p=0.13), suggesting a trend toward benefit, but not statistically significant.
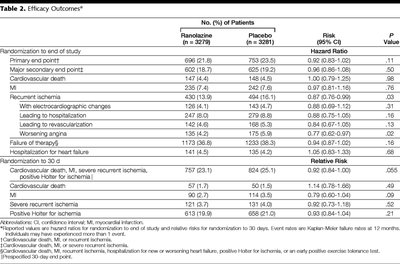
Additional info: A hazard ratio less than 1 favors the treatment, but statistical significance requires the confidence interval not to include 1 and a p-value less than 0.05.
Meta-Analysis and Clinical Decision-Making
Odds Ratio and Treatment Recommendations
Meta-analysis combines results from multiple studies to estimate effect size. In the SPAF II 75+ trial, the odds ratio for fatal outcomes was 1.1 (0.52–2.32), indicating no significant difference between warfarin and aspirin. Combined fatal and non-fatal events had an OR of 0.79 (0.61–1.02), suggesting a potential reduction in events with warfarin, but not statistically significant.
Clinical Recommendation: Due to uncertainty and overlapping confidence intervals, more studies are needed before recommending long-term anticoagulation over antiplatelet therapy.
Summary Table: Key Biostatistical Concepts
Concept | Definition | Formula |
|---|---|---|
Mean | Average value | |
Standard Deviation | Spread of values | |
Risk Ratio | Risk comparison | |
Odds Ratio | Odds comparison | |
Sensitivity | True positive rate | |
Specificity | True negative rate | |
PPV | Positive predictive value | |
NPV | Negative predictive value | |
Hazard Ratio | Event rate comparison | Calculated from survival analysis |
