 Back
BackMembrane Dynamics: Osmosis, Diffusion, and Transport Mechanisms
Study Guide - Smart Notes
 Tailored notes based on your materials, expanded with key definitions, examples, and context.
Membrane Dynamics
Fluid Compartments and Homeostasis
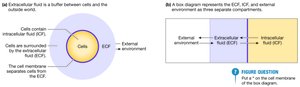
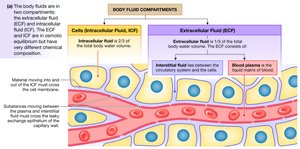
The human body maintains homeostasis by regulating the distribution of fluids and solutes between two main compartments: the intracellular fluid (ICF) and the extracellular fluid (ECF). Homeostasis does not imply equilibrium; instead, it involves dynamic steady states of osmotic, chemical, and electrical disequilibrium.
Intracellular Fluid (ICF): Fluid within cells, making up about two-thirds of total body water.
Extracellular Fluid (ECF): Fluid outside cells, including interstitial fluid and blood plasma.
Buffer Zone: ECF acts as a buffer between cells and the external environment.
Types of Disequilibrium
Homeostasis aims to maintain three dynamic steady states:
Osmotic Equilibrium: Water moves freely between compartments, so total solute concentrations are equal.
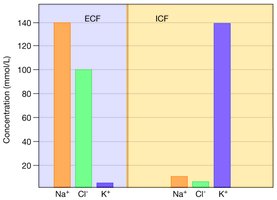
Chemical Disequilibrium: Some solutes are more concentrated in one compartment than the other.
Electrical Disequilibrium: Ions are distributed unevenly, resulting in a net negative charge inside cells and a net positive charge outside.
Osmosis and Tonicity
Osmosis
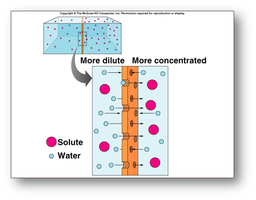
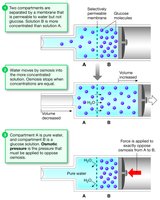
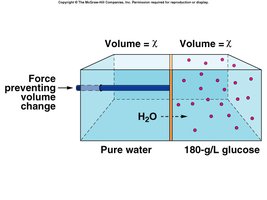
Osmosis is the movement of water across a semi-permeable membrane in response to a solute concentration gradient. Water moves to dilute the more concentrated solution, and this process is fundamental to IV therapy and fluid balance in the body.
Semi-permeable Membrane: Permeable to water, impermeable to certain solutes.
Osmotic Pressure: The pressure required to prevent water movement across the membrane.
Body Water Content
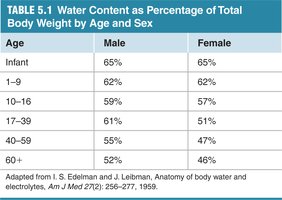
The percentage of water in the body varies by age and sex, affecting drug dosing and fluid management.
Age | Male | Female |
|---|---|---|
Infant | 65% | 65% |
1–9 | 62% | 62% |
10–16 | 59% | 57% |
17–39 | 61% | 51% |
40–59 | 55% | 47% |
60+ | 52% | 46% |
Osmolarity and Osmolality
Osmolarity is the number of osmotically active particles per liter of solution, while osmolality is per kilogram of water. Both are used to predict osmotic movement, but osmolality is more common in clinical settings.
Molarity (M): Number of molecules per liter.
Osmolarity (OsM): Number of particles per liter.
Osmolality: Number of particles per kilogram.
Comparing Osmolarities
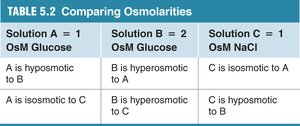
When comparing two solutions:
Isosmotic: Equal number of solute particles.
Hyperosmotic: More solute particles.
Hyposmotic: Fewer solute particles.
Solution | Osmolarity | Comparison |
|---|---|---|
A (1 OsM Glucose) | 1 | Hyposmotic to B |
B (2 OsM Glucose) | 2 | Hyperosmotic to A |
C (1 OsM NaCl) | 1 | Isosmotic to A |
Tonicity
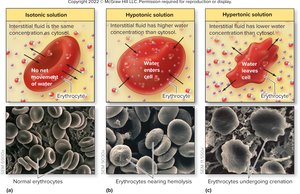
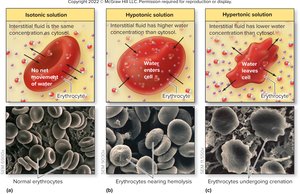
Tonicity describes how a solution affects cell volume:
Hypotonic: Cell swells (gains water).
Hypertonic: Cell shrinks (loses water).
Isotonic: Cell remains the same size.
Tonicity vs. Osmolarity
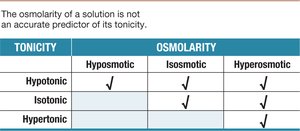
Osmolarity is measurable and compares two solutions, while tonicity is unitless and describes the effect of a solution on a cell. Tonicity depends on the concentration of nonpenetrating solutes.
Tonicity | Hyposmotic | Isosmotic | Hyperosmotic |
|---|---|---|---|
Hypotonic | ✓ | ✓ | ✓ |
Isotonic | ✓ | ✓ | |
Hypertonic | ✓ |
Clinical Application: Intravenous Solutions
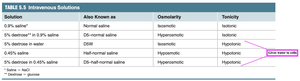
IV solutions are chosen based on their osmolarity and tonicity to treat conditions like blood loss or dehydration.
Solution | Also Known As | Osmolarity | Tonicity |
|---|---|---|---|
0.9% saline* | Normal saline | Isosmotic | Isotonic |
5% dextrose in 0.9% saline | DS-normal saline | Hyperosmotic | Isotonic |
5% dextrose in water | D5W | Isosmotic | Hypotonic |
0.45% saline | Half-normal saline | Hyposmotic | Hypotonic |
5% dextrose in 0.45% saline | DS-half-normal saline | Hyposmotic | Hypotonic |
Diffusion and Transport Processes
Diffusion
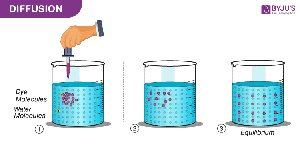
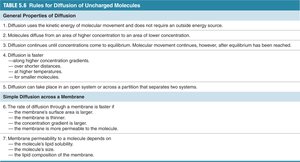
Diffusion is the passive movement of molecules from an area of higher concentration to an area of lower concentration. It is rapid over short distances but slow over long distances.
Passive Process: No energy required.
Temperature: Higher temperature increases diffusion rate.
Molecular Size: Smaller molecules diffuse faster.
Surface Area: Greater surface area increases diffusion rate.
Electrochemical Gradients
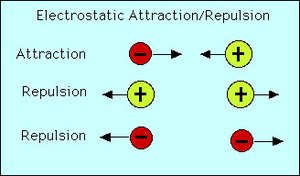
Ions move in response to both concentration and electrical gradients, known as the electrochemical gradient. Opposite charges attract, and like charges repel.
Factors Affecting Diffusion
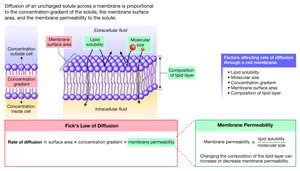
The rate of diffusion is influenced by several factors:
Concentration Gradient: Steeper gradient increases rate.
Membrane Permeability: More permeable membranes increase rate.
Surface Area: Larger area increases rate.
Lipid Solubility: Lipophilic molecules diffuse more easily.
Protein-Mediated Transport
Channel and Carrier Proteins
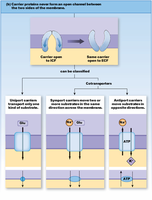
Most molecules are lipophobic or ions and require membrane proteins to cross cell membranes. Transport proteins include channel proteins (for rapid transport of small molecules) and carrier proteins (for larger molecules).
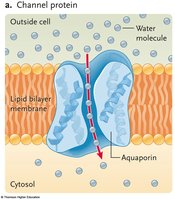
Types of Protein-Mediated Transport
Facilitated Diffusion: Passive, moves substances down their concentration gradient.
Active Transport: Requires energy, moves substances against their concentration gradient.
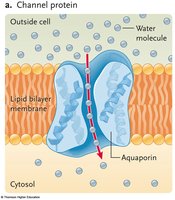
Carrier Protein Classification
Uniport: Transports one type of molecule.
Symport: Transports multiple molecules in the same direction.
Antiport: Transports molecules in opposite directions.
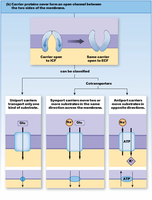
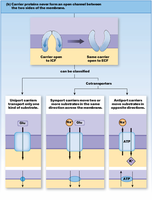
Active Transport
Primary and Secondary Active Transport
Primary Active Transport: Uses ATP directly (e.g., sodium-potassium pump).
Secondary Active Transport: Uses energy from concentration gradients created by primary transport.
Carrier-Mediated Transport Properties
Specificity, Competition, and Saturation
Specificity: Transporters move only specific molecules.
Competition: Related substrates compete for binding sites.
Saturation: Transport rate reaches a maximum when all carriers are occupied.
Vesicular Transport
Phagocytosis and Endocytosis
Phagocytosis: Engulfs large particles into vesicles.
Endocytosis: Indents membrane to form smaller vesicles; can be selective or nonselective.
Epithelial Transport
Paracellular and Transcellular Transport
Paracellular: Through junctions between cells.
Transcellular: Through the cell, crossing two membranes.
Resting Membrane Potential
Establishing and Maintaining Membrane Potential
The resting membrane potential is the electrical gradient between the ECF and ICF, primarily established by potassium ion movement and maintained by the sodium-potassium pump.
Electrochemical Equilibrium: The balance of chemical and electrical forces.
Nernst Equation: Calculates equilibrium potential for a single ion.
Goldman Equation: Considers multiple ions and their permeabilities.
Changes in Membrane Potential
Depolarization: Membrane potential becomes less negative.
Repolarization: Returns to resting potential.
Hyperpolarization: Becomes more negative than resting potential.
Integrated Membrane Processes: Insulin Secretion
Beta cells in the pancreas release insulin in response to increased glucose, involving changes in membrane potential and vesicular transport.
Additional info: This summary covers all major concepts from Chapter 5: Membrane Dynamics, including fluid compartments, osmosis, tonicity, diffusion, protein-mediated transport, vesicular transport, epithelial transport, and membrane potential, with relevant images and tables included for clarity.
