 Back
BackPharmacokinetics: Principles and Clinical Applications
Study Guide - Smart Notes
 Tailored notes based on your materials, expanded with key definitions, examples, and context.
Pharmacokinetics: Overview
Definition and Importance
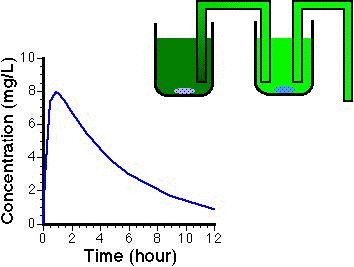
Pharmacokinetics (PK) is the study of how drug concentrations change within the compartments of the body over time. It is essential for determining proper dosing, adjusting for patient-specific factors, and ensuring therapeutic efficacy while minimizing toxicity.
Pharmacokinetics (PK): Describes absorption, distribution, metabolism, and elimination of drugs.
Pharmacodynamics (PD): Describes the relationship between drug concentration and response at the site of action.
Clinical relevance: PK guides dosing regimens, especially for drugs with narrow therapeutic windows.
Therapeutic Window and Index
Therapeutic Window
The therapeutic window is the range of drug concentrations in which a drug is effective without causing toxicity.
Minimal effective concentration: Lowest concentration at which therapeutic effect occurs.
Maximal effective concentration: Highest concentration before toxicity occurs.
Toxic concentration: Levels above which adverse effects are likely.

Therapeutic Index (TI)
The therapeutic index is a measure of drug safety, calculated as the ratio of the toxic dose to the effective dose in 50% of the population.
TI = TD50/ED50
TD50: Dose causing toxicity in 50% of subjects.
ED50: Dose causing desired effect in 50% of subjects.
Wider TI: Indicates greater safety margin.
Pharmacokinetic Modeling
Compartment Models
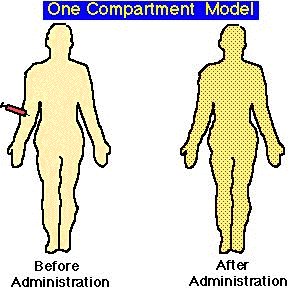
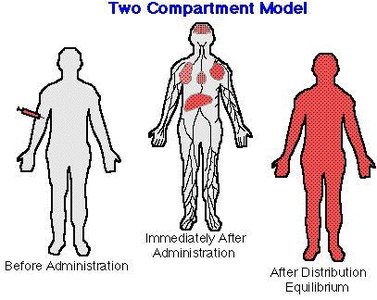
PK models simplify the body into compartments to describe drug distribution and elimination.
One-compartment model: Assumes instantaneous distribution throughout a single, homogenous compartment.
Two-compartment model: Accounts for initial distribution into central and peripheral compartments before equilibrium.
Bioavailability and Dose Adjustment
Bioavailability (F)
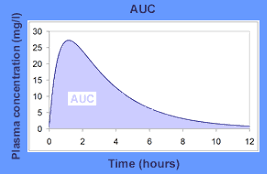
Bioavailability is the fraction of administered drug that reaches systemic circulation.
F = 1: For intravenous (IV) administration.
F < 1: For oral or other routes due to incomplete absorption or first-pass metabolism.
Calculation: Amount absorbed = F × dose.
Dose Adjustment for Route of Administration
To adjust dose for oral administration: Oral dose = IV dose / F
Example: If IV dose is 10 mg and F = 0.25, oral dose = 10 mg / 0.25 = 40 mg.
Reaction Order: Absorption and Elimination
Reaction Order
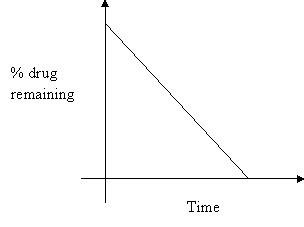
First order: Rate is proportional to drug amount.
Zero order: Rate is constant, independent of drug amount.
Absorption Rate
Zero order: Constant rate (e.g., IV infusion).
First order: Rate proportional to amount administered; described by absorption rate constant (ka).
Elimination Rate
First order elimination: Most drugs; rate proportional to concentration; described by elimination rate constant (ke).
Zero order elimination: Occurs when elimination pathways are saturated (e.g., alcohol, phenytoin).
Clearance and Volume of Distribution
Clearance (Cl)
Clearance is the volume of plasma from which drug is completely removed per unit time.
Formula:
Units: Volume/time (e.g., mL/min)
Factors affecting clearance: Organ function, blood flow, protein binding, concurrent medications.
Volume of Distribution (Vd)
Vd is a theoretical volume that relates the amount of drug in the body to the concentration in plasma.
Formula:
Units: Volume (e.g., L)
Elimination Half-life
Definition and Calculation
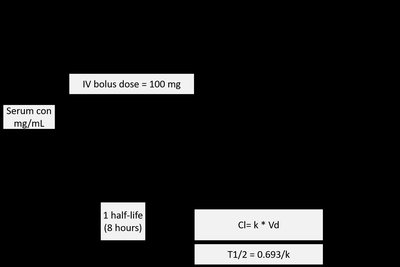
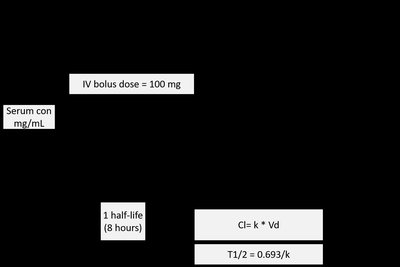
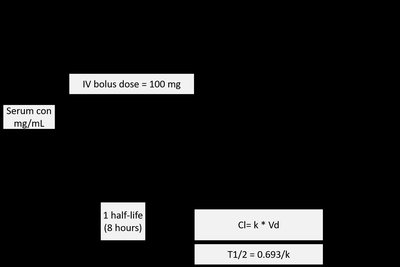
The elimination half-life is the time required for the concentration of a drug to decrease by 50%.
Formula:
Relationship: Half-life is inversely proportional to the elimination rate constant.
Clinical application: Used to predict drug accumulation and elimination.
Multiple Dosing and Steady State
Steady State
Steady state is achieved when the rate of drug administration equals the rate of elimination, resulting in a constant average concentration.
Rule of thumb: It takes 5 half-lives to reach steady state.
Steady state concentration (Css): Average of peak and trough concentrations.
Clinical Implications of Dosing Regimens
More frequent, smaller doses reduce fluctuations between peak and trough concentrations.
Less frequent, larger doses increase risk of concentrations falling below therapeutic window or rising above toxic levels.
Patient compliance may decrease with increased dosing frequency.
Loading Dose and Maintenance Dose
Loading Dose (LD)
A loading dose is used to rapidly achieve target plasma concentrations.
Formula:
For non-IV routes:
Maintenance Dose (MD)
Maintenance dose is administered at regular intervals to maintain steady state.
Formula:
For non-IV routes:
τ (tau): Dosing interval
Factors Affecting Pharmacokinetics
Renal and Hepatic Impairment
Impaired kidney or liver function can significantly alter drug clearance.
Drugs eliminated primarily by renal excretion are most affected by renal impairment.
Units and Dimensional Analysis
Pharmacokinetic Parameters and Units
Concentration: mg/L
Volume of distribution (Vd): L
Clearance (Cl): L/hr
Dosing interval (τ): hr
Rate constant (ke): hr-1
Summary Table: Key Pharmacokinetic Equations
Parameter | Equation | Units |
|---|---|---|
Clearance (Cl) | L/hr | |
Volume of Distribution (Vd) | L | |
Elimination Half-life (t1/2) | hr | |
Loading Dose (LD) | mg | |
Maintenance Dose (MD) | mg |
Additional info:
Pharmacokinetics is foundational for understanding drug action, optimizing therapy, and minimizing adverse effects.
Dimensional analysis helps construct and verify PK equations based on units.
