Skip to main content
Beginning Algebra
My Course
Learn
AI Tutor
Study Guides
Flashcards
Try the app
My Course
Learn
AI Tutor
Study Guides
Flashcards
Try the app
Back
Linear Inequalities in Two Variables definitions
You can tap to flip the card.
Linear Inequality
You can tap to flip the card.
👆
Linear Inequality
An algebraic statement comparing two expressions using symbols like <, >, ≤, or ≥, involving two variables.
Track progress
Control buttons has been changed to "navigation" mode.
1/15
Related flashcards
Recommended videos
Linear Inequalities in Two Variables quiz
Linear Inequalities in Two Variables
15 Terms
Guided course
7:02
Graphing Linear Inequalities in Two Variable
45
views
05:47
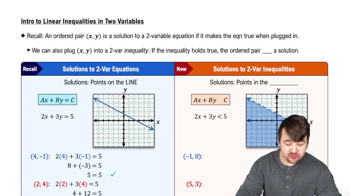
Intro to Linear Inequalities in Two Variables
64
views
Guided course
3:55
Graphing Linear Inequalities in Two Variable Example 1
54
views
Terms in this set (15)
Hide definitions
Linear Inequality
An algebraic statement comparing two expressions using symbols like <, >, ≤, or ≥, involving two variables.
Ordered Pair
A set of two numbers, typically written as (x, y), representing a point's location on a coordinate plane.
Solution Region
The shaded area on a graph where all points satisfy a given linear inequality.
Solid Line
A boundary on a graph indicating that points on the line are included in the solution set (for ≤ or ≥).
Dashed Line
A boundary on a graph showing that points on the line are not included in the solution set (for < or >).
Inequality Symbol
A sign such as <, >, ≤, or ≥ used to compare two expressions in an inequality.
Test Point
A chosen coordinate, often (0,0) or another simple value, used to determine which side of the boundary to shade.
Slope-Intercept Form
An equation format y = mx + b, making it easy to graph lines and identify slope and y-intercept.
Boundary Line
The line on a graph that separates the solution region from the non-solution region for an inequality.
Standard Form
An equation format Ax + By = C, commonly used for linear equations and inequalities.
Coordinate Plane
A two-dimensional surface defined by an x-axis and y-axis, used to plot points, lines, and regions.
Y-Intercept
The point where a line crosses the y-axis, indicating the value of y when x is zero.
Shaded Region
The area on a graph representing all solutions to a linear inequality.
Greater Than or Equal To
A comparison indicating values that are either larger than or exactly equal to another value (symbol: ≥).
Less Than or Equal To
A comparison indicating values that are either smaller than or exactly equal to another value (symbol: ≤).
 BackBack
 7:02
7:02