Skip to main content
Beginning Algebra
My Course
Learn
AI Tutor
Study Guides
Flashcards
Try the app
My Course
Learn
AI Tutor
Study Guides
Flashcards
Try the app
Back
Systems of Linear Inequalities definitions
You can tap to flip the card.
System of Inequalities
You can tap to flip the card.
👆
System of Inequalities
A set of two or more linear inequalities considered together, where the solution is the region satisfying all conditions.
Track progress
Control buttons has been changed to "navigation" mode.
1/15
Related flashcards
Recommended videos
Systems of Linear Inequalities quiz
Systems of Linear Inequalities
15 Terms
Guided course
06:26
Graphing Systems of Linear Inequalities
53
views
Guided course
06:50
Graphing Systems of Linear Inequalities Example 1
52
views
Terms in this set (15)
Hide definitions
System of Inequalities
A set of two or more linear inequalities considered together, where the solution is the region satisfying all conditions.
Boundary Line
A straight line on a graph representing the edge of the solution region for a linear inequality.
Solid Line
A continuous line used when the inequality includes equality (≤ or ≥), indicating points on the line are included.
Dashed Line
A broken line used for strict inequalities (< or >), showing points on the line are not part of the solution.
Shaded Region
The area on a graph representing all solutions that satisfy a given inequality.
Overlap
The common area where shaded regions from all inequalities intersect, representing the solution to the system.
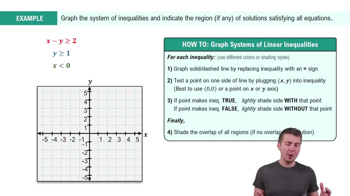
Test Point
A coordinate, often (0,0), substituted into an inequality to determine which side of the boundary line to shade.
Slope-Intercept Form
An equation format y = mx + b, making it easy to identify slope and y-intercept for graphing.
Inequality Symbol
A sign such as <, >, ≤, or ≥, indicating the relationship between two expressions.
Y-Intercept
The point where a line crosses the y-axis, used as a starting point for graphing.
Slope
A measure of a line’s steepness, calculated as rise over run between two points.
Solution Set
All coordinate pairs that satisfy every inequality in a system, typically shown as the overlapping shaded region.
False Statement
A result from substituting a test point into an inequality, indicating the point is not in the solution region.
No Solution
A situation where shaded regions do not overlap, meaning no coordinate pair satisfies all inequalities.
Graph
A visual representation on the coordinate plane showing lines and shaded regions for inequalities.
 BackBack
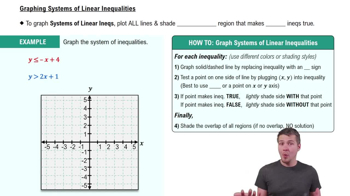
 06:26
06:26