Skip to main content
Beginning Algebra
My Course
Learn
AI Tutor
Study Guides
Flashcards
Try the app
My Course
Learn
AI Tutor
Study Guides
Flashcards
Try the app
Back
Systems of Linear Inequalities quiz
You can tap to flip the card.
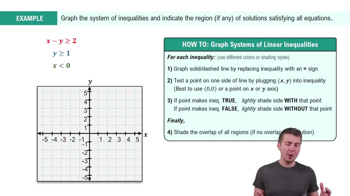
What is the first step when graphing a system of linear inequalities?
You can tap to flip the card.
👆
What is the first step when graphing a system of linear inequalities?
The first step is to graph each inequality's boundary line, treating the inequality as if it were an equation.
Track progress
Control buttons has been changed to "navigation" mode.
1/15
Related flashcards
Recommended videos
Systems of Linear Inequalities definitions
Systems of Linear Inequalities
15 Terms
Guided course
06:26
Graphing Systems of Linear Inequalities
53
views
Guided course
06:50
Graphing Systems of Linear Inequalities Example 1
52
views
Terms in this set (15)
Hide definitions
What is the first step when graphing a system of linear inequalities?
The first step is to graph each inequality's boundary line, treating the inequality as if it were an equation.
How do you decide whether to use a solid or dashed line when graphing an inequality?
Use a solid line for ≤ or ≥ and a dashed line for < or >.
What does the overlapping shaded region represent in a system of inequalities?
The overlapping shaded region is the solution set where all inequalities are true at the same time.
How can you determine which side of the boundary line to shade for an inequality?
Use a test point, such as (0,0), and substitute it into the inequality to see if it makes the statement true.
What should you do if your test point makes the inequality true?
Shade the side of the line that includes the test point.
What should you do if your test point makes the inequality false?
Shade the side of the line that does not include the test point.
Why is slope-intercept form useful when graphing inequalities?
Slope-intercept form (y = mx + b) makes it easier to identify the y-intercept and slope for graphing.
What does it mean if there is no overlapping region after shading all inequalities?
It means there is no solution to the system of inequalities.
How do you graph the line for y ≤ -x + 4?
Plot the y-intercept at 4, use a slope of -1, and draw a solid line.
How do you graph the line for y > 2x + 1?
Plot the y-intercept at 1, use a slope of 2, and draw a dashed line.
What is the purpose of using different colors or shading styles when graphing systems of inequalities?
Different colors or shading styles help distinguish the solution regions for each inequality.
What is a test point, and why is it used?
A test point is a coordinate (like (0,0)) used to determine which side of the boundary line to shade.
What do you do after shading the regions for all inequalities in the system?
Highlight or shade the area where all shaded regions overlap, as this is the solution.
Can you use any point as a test point when shading for an inequality?
Yes, as long as the point is not on the boundary line.
What should you do if the equations are not in slope-intercept form before graphing?
Manipulate the equation to get it into slope-intercept form (y = mx + b) before graphing.
 BackBack
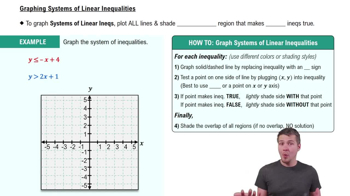
 06:26
06:26