 Back
BackIntroduction to the Cartesian Coordinate System and Graphing
Study Guide - Smart Notes
 Tailored notes based on your materials, expanded with key definitions, examples, and context.
Graphing Equations and Inequalities
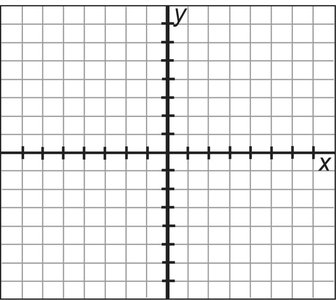
The Cartesian Coordinate System
The Cartesian coordinate system is a two-dimensional plane defined by a horizontal axis (the x-axis) and a vertical axis (the y-axis). The point where these axes intersect is called the origin, denoted as (0, 0). This system is fundamental for graphing equations and inequalities in algebra.
x-axis: The horizontal number line in the plane.
y-axis: The vertical number line in the plane.
Origin: The point (0, 0) where the x-axis and y-axis intersect.
Quadrants: The axes divide the plane into four regions called quadrants, numbered I, II, III, and IV, starting from the upper right and moving counterclockwise.
Example: The point (3, -2) is located 3 units to the right of the origin and 2 units down.
Graph Paper and Axis Emphasis
Graph paper is used to plot points, lines, and curves accurately. Sometimes, only one axis is emphasized to focus on specific types of graphs:
Emphasized y-axis: Useful for plotting vertical lines or functions where y is the main variable.
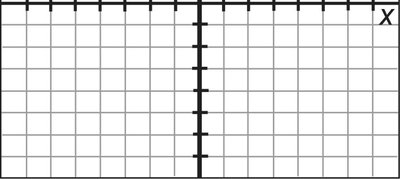
Emphasized x-axis: Useful for plotting horizontal lines or functions where x is the main variable.
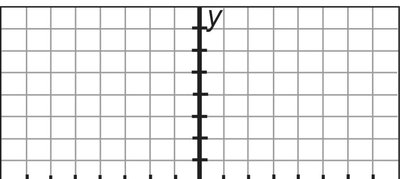
Example: To graph the equation x = 2, use a grid with an emphasized y-axis and draw a vertical line through x = 2.
Plotting Points
To plot a point, use an ordered pair (x, y):
Start at the origin (0, 0).
Move x units left (if x is negative) or right (if x is positive).
Move y units down (if y is negative) or up (if y is positive).
Example: Plotting (-4, 5) means moving 4 units left and 5 units up from the origin.
Equations of the Axes
The axes themselves can be described by simple equations:
x-axis:
y-axis:
These equations are useful for identifying points that lie directly on the axes.
Summary Table: Types of Graph Paper and Their Uses
Graph Type | Description | Common Use |
|---|---|---|
Full Cartesian Plane | Both x and y axes shown, with origin at center | General graphing of equations and inequalities |
Emphasized y-axis | y-axis bolded, x-axis less prominent | Vertical lines, functions of y |
Emphasized x-axis | x-axis bolded, y-axis less prominent | Horizontal lines, functions of x |
Additional info: These graph templates are foundational for plotting linear equations, inequalities, and other algebraic relationships. Mastery of the coordinate plane is essential for success in algebra and higher mathematics.
